

Stock Market Commentary
The stock market endured what Yahoo Finance dubbed a whirlwind week, and remarkably, the market came through largely unscathed and continued to hold highs. The July 9th expiration of the pause on reciprocal tariffs generated a wide range of outcomes – letters, temporary deals, and even punitive measures. Yet, the stock market barely blinked. Although the week ended on a down note, it was not a significant pullback.
Despite macroeconomic and geopolitical tensions, the market floated, supported by strong technical levels and a steady trading rhythm. Although I remain cautiously bullish, I am growing more wary of the potential for buying strength to wane around these all-time highs. The market’s resilience remains noteworthy, but this ability to hold highs is not a reason for complacency, or, even worse, pressing highly speculative bets. As always, we’ll see what the coming days bring.
The Stock Market Indices
S&P 500 (SPY)
The S&P 500 opened down on Monday and drifted higher for two days before settling back to its starting point. The week ended with the index pulling away from its upper Bollinger Band (BB), signaling a potential sharp move ahead—either toward new all-time highs or a sudden pullback to support. With earnings season approaching, volatility may soon pick up.
")
NASDAQ (COMPQ)
The NASDAQ followed a similar path to the S&P 500, closing just below its all-time high. Like SPY, the tech-laden index faces the possibility of breaking out or falling back to support, especially as earnings season begins. Your bearish or bullish orientation will shape your expectations for the resolution of this drift.
")
iShares Russell 2000 ETF (IWM)
Small caps led for most of the week. IWM dropped 1.4% on Monday, then rallied to a new five-month high at $224.80. However, Friday’s significant pullback reversed those gains and pulled the ETF of small caps away from its upper-BB, putting it at risk for a deeper retreat to converging support waiting at the 20-day moving average (DMA) (the dotted line) and the 200DMA (the blue line).
")
The Short-Term Trading and Hold Highs
- AT50 (MMFI) = 70.5% of stocks are trading above their respective 50-day moving averages (8th overbought day)
- AT200 (MMTH) = 53.6% of stocks are trading above their respective 200-day moving averages
- Short-term Trading Call: cautiously bullish
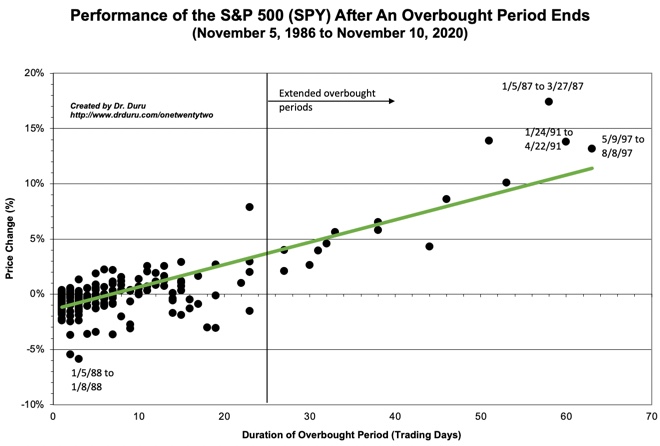
AT50 (MMFI), the percentage of stocks trading above their 50DMAs, closed the week at 70.5%. This stalemate at the overbought threshold followed a week of tepid volatility—starting with a drop, a recovery toward breakout, and then another pullback. This 8th straight day trading in overbought territory is part of a 2-month period with my favorite technical indicator pivoting around the overbought threshold. By default, I am interpreting this overbought “steady state” as bullish, a demonstration of buying resilience per the AT50 trading rules. If I liberally interpret this two months hanging around overbought conditions, then the S&P 500 is already in a bullish “lift-off” per the chart below. (And yes, it’s time for an update!)
AT200 (MMTH), the percentage of stocks trading above their 200DMAs, briefly improved Thursday, returning to levels last seen when SPY hit previous all-time highs—a strong signal for long-term market health. However, Friday reversed those gains, bringing AT200 down to 53.6%. I remain optimistic as long as AT200 turns upward from here.
The Equities: Hold Highs
Chipotle Mexican Grill (CMG)
Summary: A promising breakout reversed to test 200DMA support.
Technical Status: Pulled back from recent highs; 200DMA is holding as support.
Trade Commentary: I am holding shares and bought call options on the test of 200DMA support.
")
Estee Lauder Companies, Inc. (EL)
Summary: Upgraded by an analyst, triggering a breakout.
Technical Status: Broke out from a long recovery rally; far from support.
Trade Commentary: I bought shares on the breakout and set a tight stop below a full reversal of Thursday’s gains. I will exit if price closes below $86.63 or so.
")
Fair Isaac Corporation (FICO)
Summary: Rejected at 50DMA resistance on high volume after FHFA director gave permission to mortgage lenders to use alternative credit scores.
Technical Status: Bearish failure at 50DMA with large-volume decline.
Trade Commentary: Fortunately, I took profits as FICO approached 50DMA resistance. As I discussed last month, I was wary about jumping back into FICO. Now I am hands off given the bearish momentum is building. FICO looks ready to breakdown to a new low for the year.
")
Helen of Troy Limited (HELE)
Summary: Earnings miss led to a sharp decline.
Technical Status: Hit new major low, back to 2009–2010 levels.
Trade Commentary: I am still holding a small speculative position that I initiated thinking the market was generally rotating out of winning stocks into losers. My dare to hold through earnings blew up on me. I will stop out on a new post-earnings low.
")
Academy Sports and Outdoors (ASO)
Summary: Broke out above its 200DMA; recovering from a long downtrend.
Technical Status: Reclaimed 200DMA; next resistance at $61.
Trade Commentary: I am holding a position and moved up my stop to $48. I will consider adding to my position on further strength.
")
iShares Expanded Tech-Software Sector ETF (IGV)
Summary: Mild rotation out of software stocks.
Technical Status: Fell 2% from all-time highs, breaking below double top between December and February.
Trade Commentary: I am not trading IGV, but watching closely as an indicator for software sector sentiment. I hold a number of software stocks.
")
Verint Systems (VRNT)
Summary: Buyout rumor stalled and 200DMA resistance holds.
Technical Status: Holding at 200DMA resistance; watching for move to 50DMA support around $18.50.
Trade Commentary: I hold a position in VRNT and have written about the stock on Seeking Alpha. I will add more shares if VRNT pulls back to 50DMA support.
")
IonQ (IONQ)
Summary: Failed breakout over resistance from May’s high set by a 36.5% surge.
Technical Status: Dropped 9.0% on reversal from testing prior high.
Trade Commentary: IONQ is my favorite speculation in quantum computing. I was hoping my last trade would last for a while. Instead, I exited to preserve profits after the sharp reversal from resistance at the high set by May’s surge. Now the wait for the next buying opportunity like a successful test of 50DMA support.
")
iShares Silver Trust (SLV)
Summary: Major breakout resolves Bollinger Band squeeze to the upside
Technical Status: Over-extended above upper BB on a strong 3.8% gain to a 13+ year high.
Trade Commentary: SLV was a big miss for me. I meant to buy SLV call options as the ETF held firm at 20DMA support. Thursday’s 2.3% jump away from 20DMA support was a definite buy signal. Now I wait hoping for some kind of pullback to buy.
")
")
Be careful out there!
Footnotes
Subscribe for free to get email notifications of future posts!
“Above the 50” (AT50) uses the percentage of stocks trading above their respective 50-day moving averages (DMAs) to measure breadth in the stock market. Breadth defines the distribution of participation in a rally or sell-off. As a result, AT50 identifies extremes in market sentiment that are likely to reverse. Above the 50 is my alternative name for “MMFI” which is a symbol TradingView.com and other chart vendors use for this breadth indicator. Learn more about AT50 on my Market Breadth Resource Page. AT200, or MMTH, measures the percentage of stocks trading above their respective 200DMAs.
Active AT50 (MMFI) periods: Day #38 over 20%, Day #36 over 30%, Day #31 over 40%, Day #26 over 50%, Day #24 over 60%, Day #3 under 70%
Source for charts unless otherwise noted: TradingView.com
Full disclosure: long IWM shares, long VRNT, long CMG, long EL, long HELE, long ASO,
FOLLOW Dr. Duru’s commentary on financial markets via StockTwits, BlueSky, and even Instagram!
*Charting notes: Stock prices are not adjusted for dividends. Candlestick charts use hollow bodies: open candles indicate a close higher than the open, filled candles indicate an open higher than the close.
* Blog notes: this blog was written based on the heavily edited transcript of the following video that includes a live review of the stock charts featured in this post. I used ChatGPT to process the transcript.