

Stock Market Commentary
Big news: the oversold period is officially OVER. This tariff tainted oversold period was lasted a historical 12 trading days. Several catalysts emerged during and after market hours to support a narrative of a sustained bottom, including:
- U.S. Treasury Secretary Scott Bessent indicated that tariff tensions with China will de-escalate.
- President Trump claimed the 145% tariff rate on China will come down.
- Trump also claimed he has no intention of firing Fed Chair Jerome Powell, a key reassurance for markets.
- Tesla’s high profile earnings report after hours included a promise from Elon Musk that he would reduce his DOGE (Department of Government Efficiency) duties starting in May in order to focus more on his businesses.
While the length of the oversold period confirms bear market trading, these developments suggest the market could avoid imminently re-entering another oversold period. As I have stated before, trading for an oversold bounce can rely on a particular dynamic of market and policy response: the market panics (or crashes or collapses or…), policy makers panic, policy makers act, the market rejoices. I observed hints of this dynamic during the tariff tainted oversold period. However, the presiding message from policymakers remained one of dogged determination to stay the course of economic chaos and uncertainty to get to the presumed green pastures on the other side. Finally, policymakers seem “panicked” enough (not overtly of course) to respond to the market’s panic.
The Stock Market Indices
S&P 500 (SPY)
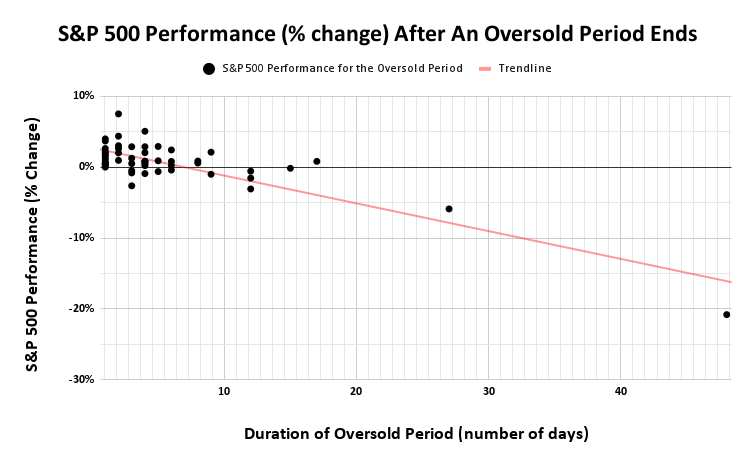
The oversold period began on April 3 and ended on April 22, with the S&P 500 falling 2% over that time – a move that perfectly aligns with the expected drop based on the duration of oversold periods. Even I am startled by how well this tariff tainted oversold period aligned with the expected trend based on historical data (since 1950). This episode once again reminded me why I stick to the AT50 trading rules.
However, caution is warranted (of course!). A steep downtrend from the 20-day moving average (DMA) (the dotted line below) remains as stiff resistance. Even after surpassing this level, resistance at the 50DMA (red line) and then the 200DMA (blue line) lay ahead. If nothing else changes on the macro-economic front, I doubt the S&P 500 will hold sufficient buying power to push through all this resistance in coming weeks.
NASDAQ (COMPQ)
The NASDAQ briefly dipped back into conventional bear market territory on Monday, but unlike last time when it spent three days there, it emerged after just one day. I was bracing for a much longer visit. This shorter visit suggests that tech sellers are losing momentum. Still, like the S&P 500, the NASDAQ failed decisively at its 20DMA resistance on its last rally attempt and must still confront additional overhead resistance.
The iShares Russell 2000 ETF (IWM)
IWM continues to trade between its pre-pandemic high and conventional bear market line. The ETF of small caps remains weaker than the major indices, last Friday being a rare exception, failing to even test its 20DMA since its bear market breakdown.
The Short-Term Trading Call With the End of A Tariff Tainted Oversold Period
- AT50 (MMFI) = 22.0% of stocks are trading above their respective 50-day moving averages (ending 12 days oversold)
- AT200 (MMTH) = 25.7% of stocks are trading above their respective 200-day moving averages
- Short-term Trading Call: bullish
AT50 (MMFI), the percentage of stocks trading above their respective 50DMAs, surged 6 percentage points to 22.0%. This jump ended the tariff tainted oversold period at a duration of 12 days. As shown in the graph at the beginning of this post, only 7 other oversold periods lasted this long or longer. Per the AT50 trading rules, conservative oversold traders can finally step in to buy. However, two major technical caveats await buyers in this market. In addition to the overhead technical resistance I described above, the volatility index (VIX) remains elevated and has not yet made a new low. Thus there is enough kindling of fear out there to reignite a spike higher. The VIX may not cool down significantly from here until earnings seasons gets close to its end.
The Equities
Meta Platforms, Inc. (META)
META’s prior uptrend was historic, with buying for 19 straight trading19 days. So its current under-performance sticks out as very ironic. On Monday, the stock closed at a new low not seen since August, showing significant relative weakness—even as the oversold period ended. META could not even hold a reversal of Monday’s gap down. Still, I might try to trade META for a rebound to 20DMA resistance ahead of earnings on April 30th.
3M Company (MMM)
3M reported earnings and responded with a bullish close above its 200DMA (the blue line). I look for these kinds of setups post-earnings: positive earnings, post-reporting relief, and a key technical breakout. However, two downtrend lines and resistance from a triple top lie ahead, so the path higher will be challenging.
Earnings results for MMM were ok, but the company surprisingly clung to its earnings guidance for the quarter despite having a host of products impacted by tariffs. The company likely impressed markets most by increasing its plans to repurchase shares in 2025 from $15B to $2.0B.
Dollar Tree, Inc. (DLTR)
I have called out the intriguing strength and bottoming action in Dollar General (DG). I took profits on my latest call option only to notice that DLTR is now breaking out. DLTR confirmed a 200DMA breakout on Monday, but today’s 3.2% gain made the breakout more convincing. I have DLTR on my buy list for this week; I want to buy and hold shares for what could be a sustained run-up.
The U.S. Dollar (DXY)
The U.S. dollar responded very favorably to Trump’s retreat on his threats to get rid of Fed Chair Powell. The U.S. dollar index gained 1.3% on the day with the USD/JPY currency pair making the most convincing reversal. USD/JPY turned on a dime right at the intraday low from September, 2024 which in turn was just below the December, 2023 low. At the time of writing, USD/JPY is fading from its highs. Still, I am looking to get net long the U.S. dollar.
SPDR Gold Trust (GLD)
The overheated trading in GLD may finally be over for now. After gapping higher and gaining 3.1% to a fresh all-time high, GLD lost 1.4% and printed an ominous bearish engulfing top. The dollar’s strength is gold’s weakness in this case. Still, I am eager to get back into gold on a pullback. I would love another test of 50DMA support.
Be careful out there!
Footnotes
Subscribe for free to get email notifications of future posts!
“Above the 50” (AT50) uses the percentage of stocks trading above their respective 50-day moving averages (DMAs) to measure breadth in the stock market. Breadth defines the distribution of participation in a rally or sell-off. As a result, AT50 identifies extremes in market sentiment that are likely to reverse. Above the 50 is my alternative name for “MMFI” which is a symbol TradingView.com and other chart vendors use for this breadth indicator. Learn more about AT50 on my Market Breadth Resource Page. AT200, or MMTH, measures the percentage of stocks trading above their respective 200DMAs.
Active AT50 (MMFI) periods: Day #1 over 20% (overperiod ending 12 days oversold), Day #17 under 30%, Day #38 under 40%, Day #50 under 50%, Day #75 under 60%, Day #176 under 70%
Source for charts unless otherwise noted: TradingView.com
Full disclosure: long SPY shares and put spread, long META, long USD/JPY
FOLLOW Dr. Duru’s commentary on financial markets via StockTwits, BlueSky, and even Instagram!
*Charting notes: Stock prices are not adjusted for dividends. Candlestick charts use hollow bodies: open candles indicate a close higher than the open, filled candles indicate an open higher than the close.
* Blog notes: this blog was written based on the heavily edited transcript of the following video that includes a live review of the stock charts featured in this post. I used ChatGPT to process the transcript.