

Stock Market Commentary
We finally got a breather: a calm weekday and a holiday for both the US stock and bond markets. The break felt more relieving than even the tariff pause, a sign of just how tense things have been in the markets. Market breadth was my major headline as twice in the week, including Thursday, the oversold period looked ready to come to an end. Instead, the market only came oh so close to an end to oversold trading.
Among the week’s major developments, Federal Reserve Chair Jerome Powell acknowledged the Fed is stuck between stagflationary pressures. This admission carried heavy implications, especially as President Trump considers removing Powell—despite legal constraints. This brewing and ominous conflict between the executive branch and central bank independence is likely weighing heavily on U.S. financial markets. History shows that markets react poorly when political winds and machinations capture monetary policy. The unsettling uncertainty alone could weigh heavily on both the US bond market and the dollar.
The Stock Market Indices
S&P 500 (SPY)
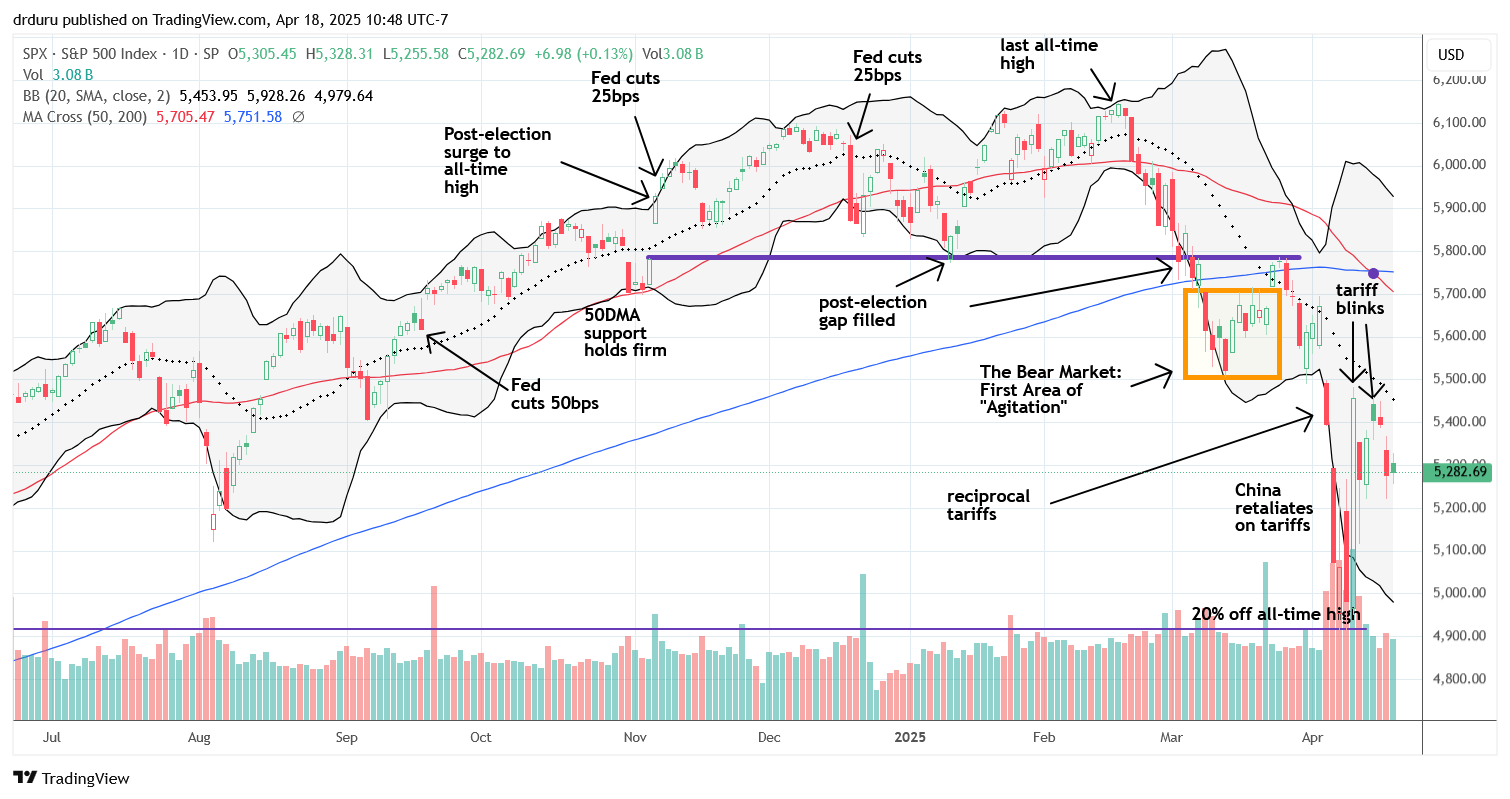
The S&P 500 (SPY) confirmed resistance from its declining 20-day moving average (DMA) (the dotted line). The 20DMA has been a formidable barrier ever since the index confirmed resistance at its 200DMA last month. The index should continue to trade within a tight range until a fresh negative catalyst emerges. I am still bracing for a break below recent lows based on technical precedent.
NASDAQ (COMPQ)
The NASDAQ also confirmed resistance at its 20DMA. More critically, the tech laden index held above the conventional bear market line – 20% down from its all-time high. This line has proven to be an important technical level, and algorithms are likely watching closely. I cautiously bought into a bounce with a calendar call spread with the short side already expired. I am ready to get more aggressive if the NASDAQ shows positive trading momentum early in the week.
")
The iShares Russell 2000 ETF (IWM)
IWM continues to trade within its range between the conventional bear market line and the pre-pandemic high. The ETF of small caps actually gained 0.8% and outperformed the major indices. These stocks also helped bring the oversold period oh so close to an end.
")
The Short-Term Trading Call When Oh So Close
- AT50 (MMFI) = 19.2% of stocks are trading above their respective 50-day moving averages (Day #11 of oversold period)
- AT200 (MMTH) = 24.5% of stocks are trading above their respective 200-day moving averages
- Short-term Trading Call: bullish
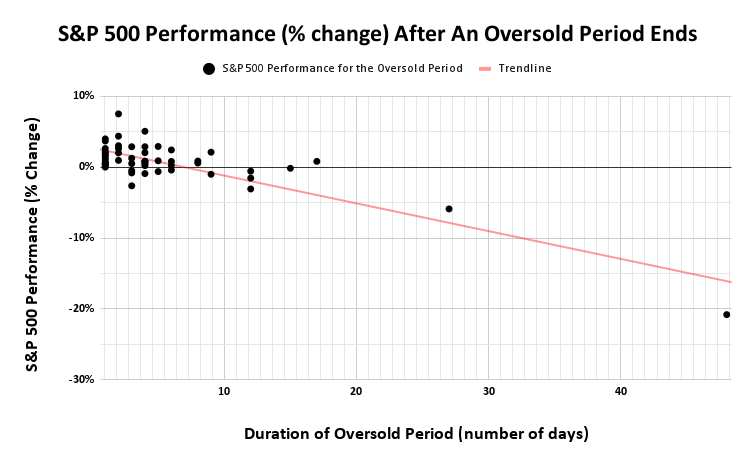
The percentage of stocks trading above their 50DMAs, AT50 (MMFI), remained in oversold territory for the 11th consecutive trading day. When the oversold period began, I asked the question “so what?” At the time I was feeling the weight of a larger bear market. Now, 11 trading days in, this extended oversold period indeed reinforces bear market behavior despite the short-term bullish implications of oversold trading. My favorite technical indicator briefly crossed above the 20% oversold threshold twice during the week. On Thursday, AT50 reached 20.04%, before pulling back to 19.2%. In a bull market, this “tease” would have been enough for me to celebrate the end of oversold trading. However, with AT50 trending lower and suffering through a historically extended oversold period, I must remain measured. There are only 7 other oversold periods that have lasted longer than the current one (since 1950).
The Equities
UnitedHealth Group Incorporated (UNH)
UNH suffered a post-earnings collapse of 22.4%, gapping down below both the 50DMA and 200DMA. Previously considered a defensive play, the stock is now testing the bottom of a long-term trading range dating back to late 2021. UNH is too extended to the downside for me to short, but I will fade a rally to or toward the post-earnings open.
")
Eli Lilly and Co. (LLY)
LLY soared 14.3% on positive GLP-1 drug news but stopped between its 50DMA and 200DMA. It remains stuck in a trading range that has persisted since early 2024. It’s a good result, but the stock still needs to break resistance to regain upward momentum.
")
Dollar General Corporation (DG)
DG gained 4.2%, breaking out above its 200DMA for the second time this month, and the momentum suggests more upside. I pointed out DG’s strength on the first breakout and claimed the stock is a buy on the dips. So I went into this second breakout holding a call option as the stock held 20DMA support. I cannot quite understand why this bottoming process is unfolding. My best guess is that investors are worrying about a recession that will push consumers toward discount retailers no matter how high prices go with tariffs.
")
Walmart Inc. (WMT)
America’s favorite discount retailer is also displaying its own version of strength. WMT is attempting a comeback after a 6.5% post-earnings drop last month. The stock recovered from a 200DMA breakdown and now clings to 50DMA as fresh support. This resilience is another possible indicator of economic stress driving investors to discount plays.
")
SPDR Select Sector Fund – Consumer Discretionary ETF (XLY)
Consumer discretionary sits at the opposite end of discount retailers. Based on confirmed resistance at a downtrending 20DMA, I bought a put spread as a small hedge against my bullishness. XLY is filled with discretionary names that will likely suffer during an economic slowdown.
")
LGI Homes, Inc. (LGIH)
LGIH continues its consistent downtrend, even approaching pandemic-era lows. Its market presence in strong-growth southern states like Texas, Florida, and the Carolinas makes this underperformance even more alarming. LGIH is one of the weakest homebuilders I follow.
")
Dave & Buster’s Entertainment Inc. (PLAY)
PLAY is slowly waking up after churning post-earnings. Insiders have been buying, including the CEO, so I am inclined to stick with PLAY until I am absolutely forced to stand down and take a loss.
")
IonQ, Inc. (IONQ)
While I think the current economic chaos is a poor environment for speculating, some quantum computing stocks like IONQ are surprisingly remaining resilient. IONQ is one of the 24.5% of stocks that is still trading above its 200DMA. However, IONQ is still one of the 81% of stocks stuck below its 50DMA. I am a buyer on a 50DMA breakout.
")
")
")
Be careful out there!
Footnotes
Subscribe for free to get email notifications of future posts!
“Above the 50” (AT50) uses the percentage of stocks trading above their respective 50-day moving averages (DMAs) to measure breadth in the stock market. Breadth defines the distribution of participation in a rally or sell-off. As a result, AT50 identifies extremes in market sentiment that are likely to reverse. Above the 50 is my alternative name for “MMFI” which is a symbol TradingView.com and other chart vendors use for this breadth indicator. Learn more about AT50 on my Market Breadth Resource Page. AT200, or MMTH, measures the percentage of stocks trading above their respective 200DMAs.
Active AT50 (MMFI) periods: Day #11 under 20% (oversold), Day #15 under 30%, Day #36 under 40%, Day #48 under 50%, Day #73 under 60%, Day #174 under 70%
Source for charts unless otherwise noted: TradingView.com
Full disclosure: long SPY shares and put spread, long QQQ call, long DG call, long PLAY
FOLLOW Dr. Duru’s commentary on financial markets via StockTwits, BlueSky, and even Instagram!
*Charting notes: Stock prices are not adjusted for dividends. Candlestick charts use hollow bodies: open candles indicate a close higher than the open, filled candles indicate an open higher than the close.
* Blog notes: this blog was written based on the heavily edited transcript of the following video that includes a live review of the stock charts featured in this post. I used ChatGPT to process the transcript.