Stock Market Commentary
The S&P 500 delivered only a brief respite from the bear market when it broke out above its 200-day moving average (DMA) to start the week. Two days later, the bear market reasserted itself. Another two days later, the sellers punched an exclamation mark on the bear market as a “hot” inflation read renewed concerns that the Federal Reserve will be unable to cut rates anytime soon. In between, there was an uneasy market calm in the wake of President Trump’s hefty tariffs on imported cars even as auto related stocks experienced a spike in volatility.
Anyone following my Inflation Watch blog knows that I am not one bit surprised by stubbornly high reports on inflation. I AM surprised the market reacted so violently to the report. I suspect the looming implementation of reciprocal tariffs and the fresh wounds of auto tariffs combined to pull stagflationary fears into the foreground. Financial markets have not faced the prospects of stagflation in decades, so it could take a good amount of time before the market moves on from these fears. I was hopeful that the “tariff flexibility” countdown would feature a market rally into the April 2nd reciprocal tariffs, called “Liberation Day” by the President, before selling pressures resumed. Instead, this date now acts as a ticking time bomb for market sentiment.
The Stock Market Indices
S&P 500 (SPY)
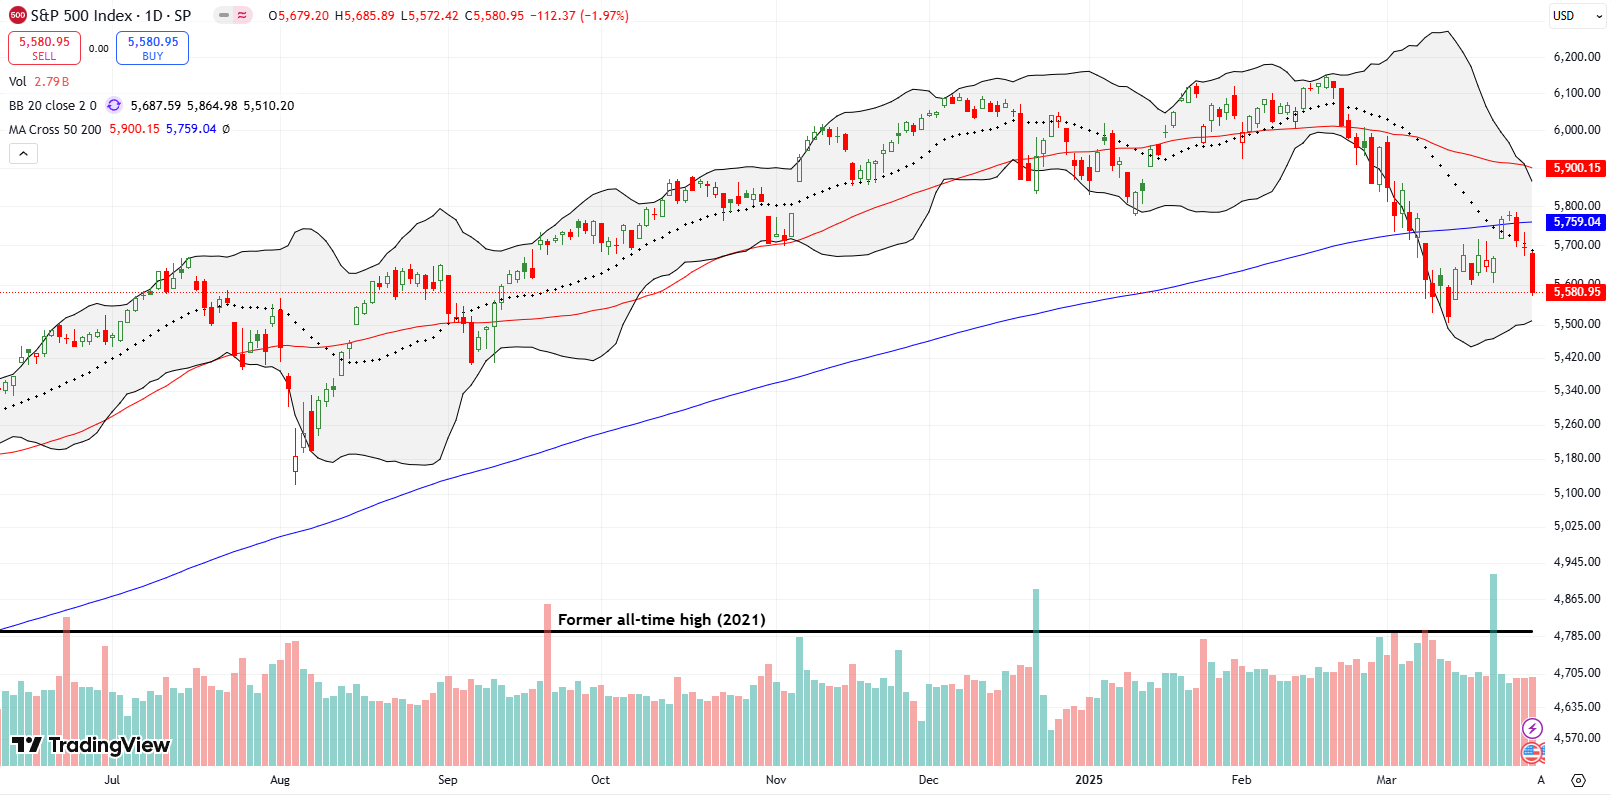
This week began with great promise. Monday’s breakout above the 200DMA (blue line in the chart below) led me to declare the bear market over for the S&P 500 (SPY). A marginal confirmation of the breakout suggested on-going strength, and I was optimistic that the index was ready to next challenge resistance at its 50DMA.
But instead, SPY hit strong resistance at a key level I have had marked for months: the post-election close (Tuesday, November 5, 2024). That price level, 5783, has consistently acted as both support and now resistance. Buyers who got trapped by the early March breakdown from this support were likely relieved to get the opportunity to sell at previous support. And thus a tough resistance line is born! If I had been bearish on the stock market, I would have been faster to recognize the resistance beyond the two SPY put options I bought as a hedge. Instead, I am just thankful I took some profits on short-term trading positions during Monday’s rally.
The S&P 500 is headed for its worst March performance since the onset of the pandemic. Ironically, March is typically the most benign month of the year for drawdowns.
NASDAQ (COMPQ)
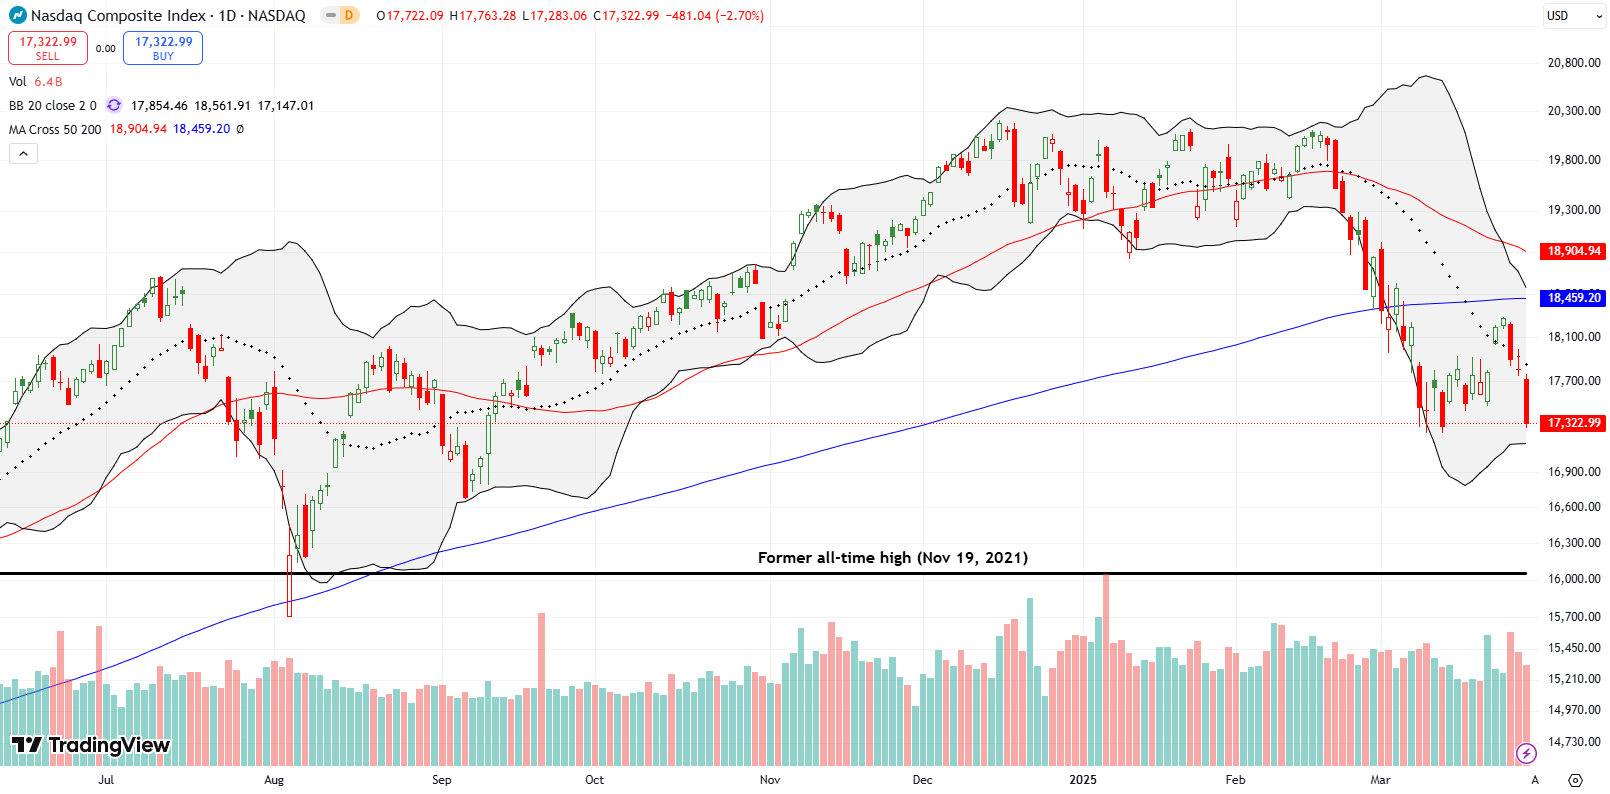
The NASDAQ never exited its bear market, and its pullback this week was even more damaging. Despite a brief breakout above the 20DMA (the dotted line), the tech laden index failed to reach its 200DMA before sellers slammed it. Friday’s 2.7% drop brought the NASDAQ right back to its prior low.
The index now teeters on the edge of a further breakdown. A move toward 16,000 is in play, aligning with the August, 2024 bottom. That level is significant given it was the last time the NASDAQ rebounded from 200DMA support. That level also coincides with the former all-time high going all the way back to November 19, 2021. I am inclined to chase the NASDAQ with puts if it moves below the March low.
The iShares Russell 2000 ETF (IWM)
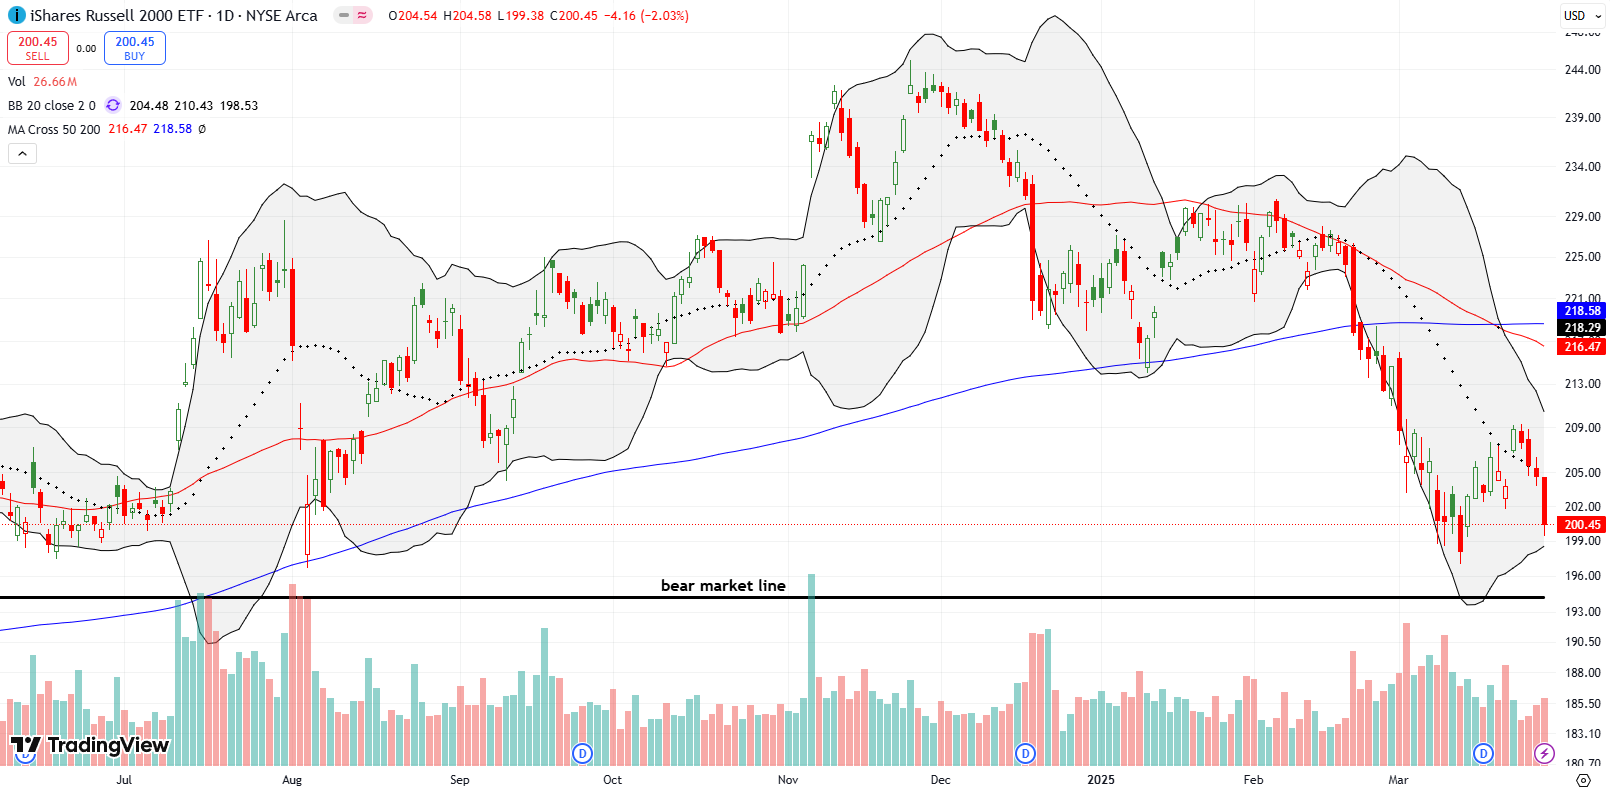
During risk-off periods, small caps have recently performed similarly to tech stocks. However, on a relative basis, the ETF of small caps is doing better than the NASDAQ right now. IWM avoided testing its March lows, despite a 2% decline on Friday. As I am prone to do on extreme down days for IWM, I bought a call option to profit on the next rebound.
Note that IWM is still hovering above the bear market threshold, conventionally defined as a 20% decline from the all-time high.
The Short-Term Trading Call With Tariff Flexibility
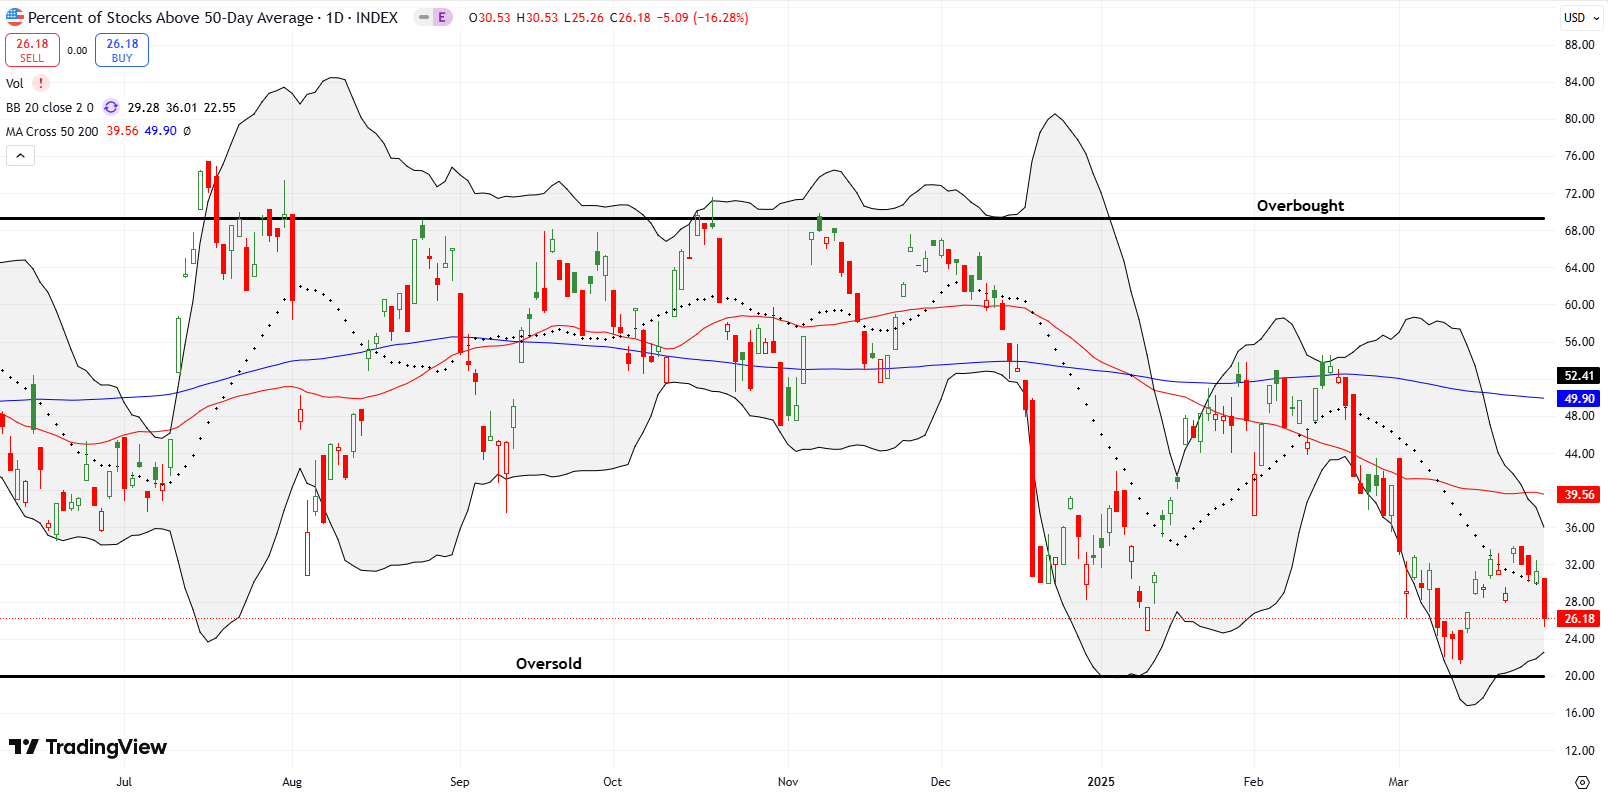
- AT50 (MMFI) = 26.2% of stocks are trading above their respective 50-day moving averages
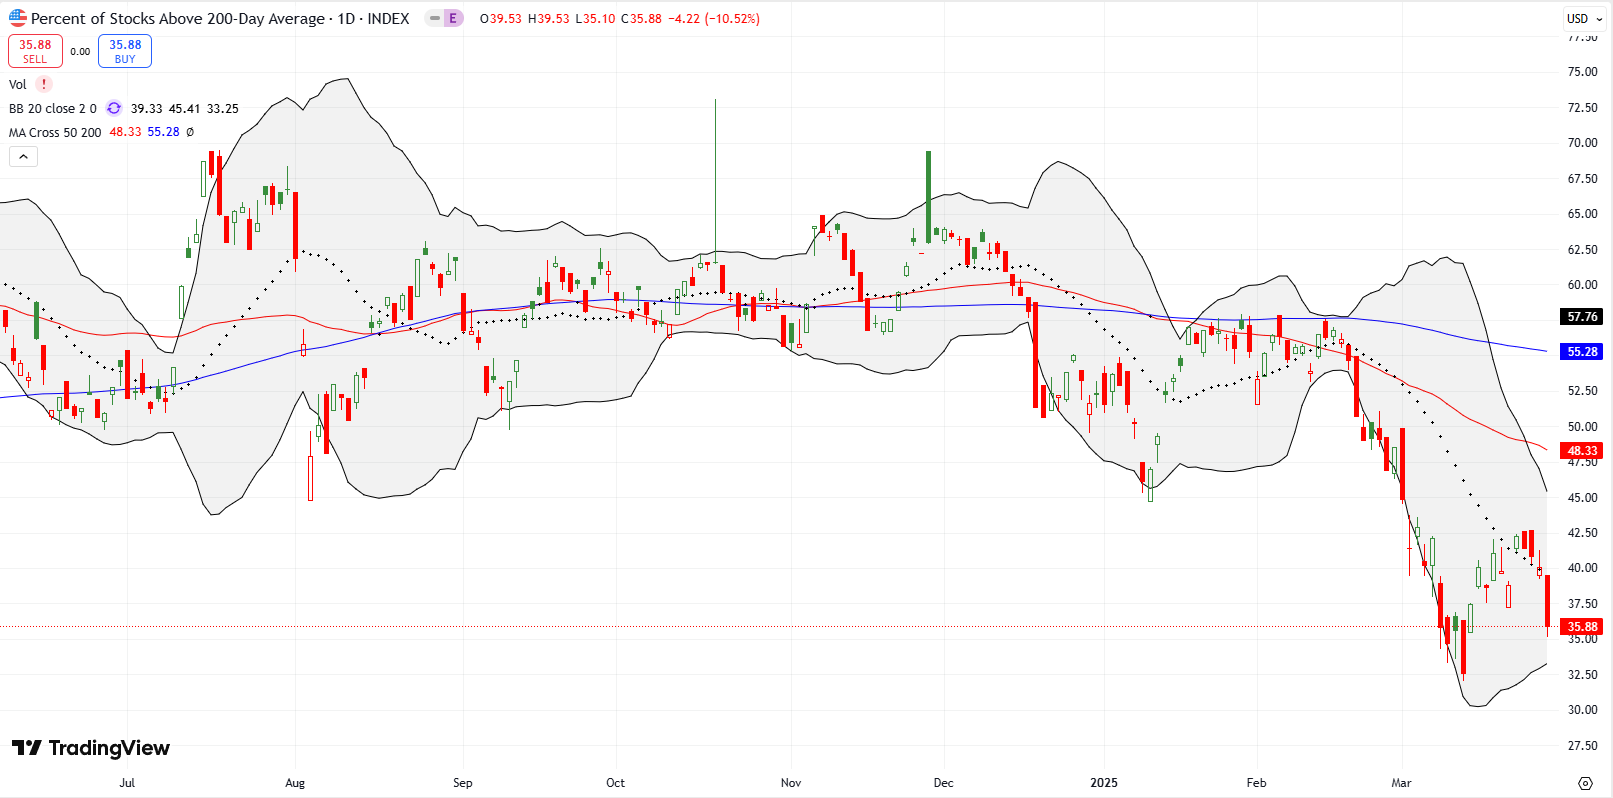
- AT200 (MMTH) = 35.9% of stocks are trading above their respective 200-day moving averages
- Short-term Trading Call: cautiously bullish
AT50 (MMFI), the percentage of stocks trading above their respective 50DMAs, closed the week at 26.2%. I had hoped the recent bounce would push market breadth into the 40–50% range. That hope completely imploded on Wednesday. Friday’s plunge in market breadth looked ominous, but, for now, the pullback looks like a natural component of bounces from oversold conditions in a bear market. I am leaving the short-term trading call at cautiously bullish as long as oversold conditions (AT50 below 20%) remain close by.
Still, the expanding technical damage is evident all over the stock market. For example, my favorite stock scanning platform, SwingTradeBot, flipped all its short-term trends from flat and yellow to down and red. On Tuesday all the short-term trends pointed upward and green.
A failed breakout for AT200 (MMTH), the percentage of stocks trading above their respective 200DMAs, put the recent March low back into play. A breakdown from there would do significant damage to the longer-term health of the stock market and put into play a test of the lows from late November, 2023.
The scale of Friday’s sell-off pushed the VIX to a 16% surge. The VIX is back in elevated volatility territory, defined as VIX readings of 20 or above. The technical damage across indices suggests that the VIX is poised to retest its previous high, if not exceed it….absent a last minute salve of positive news.
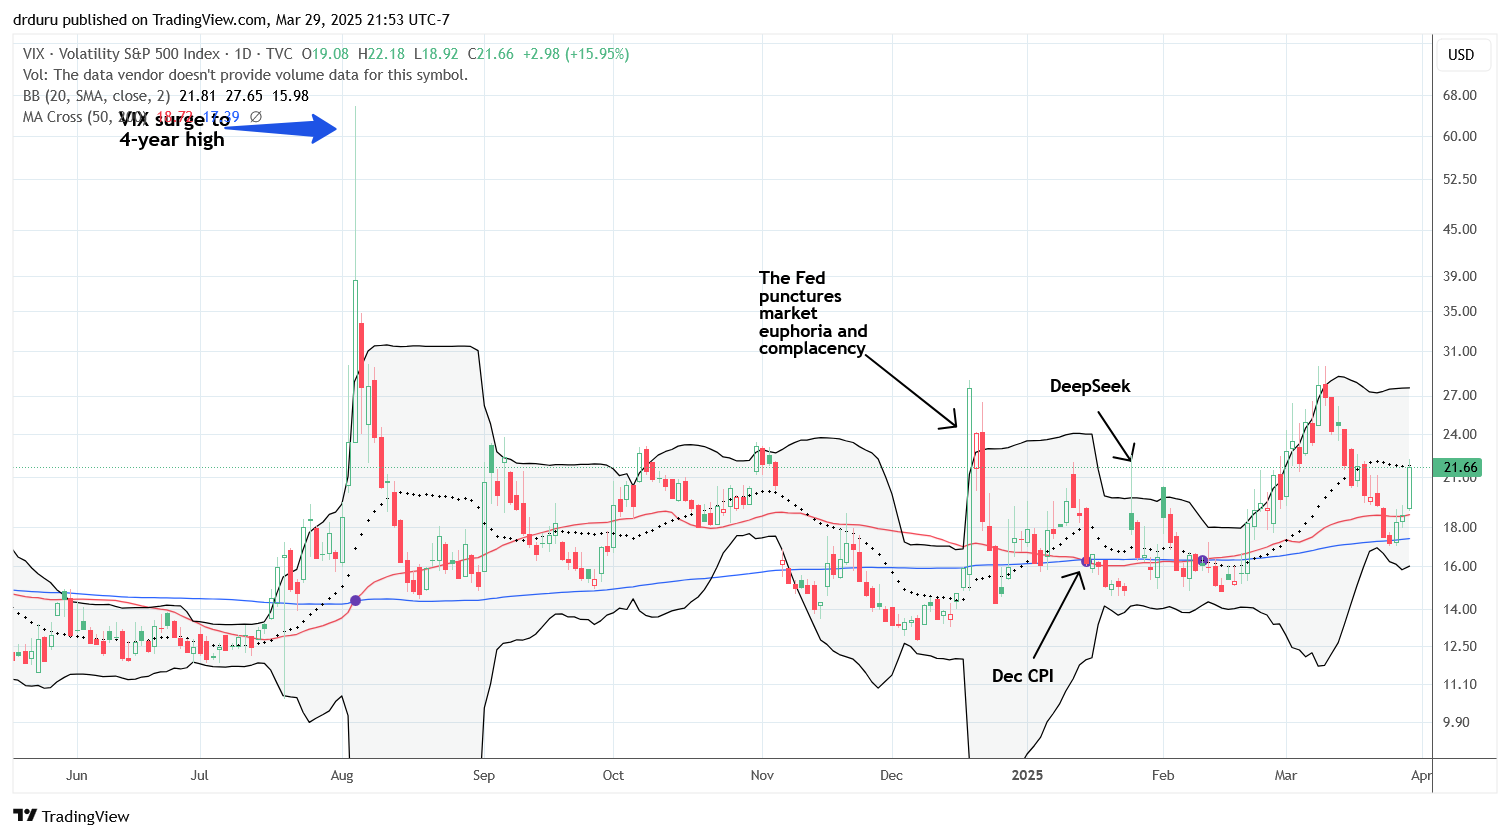
The stock market is in a race against the latest tariff countdown. The market has two full trading sessions to absorb the latest shocks.
The Equities: The Bear Market Reasserts Itself
Magna International (MGA)
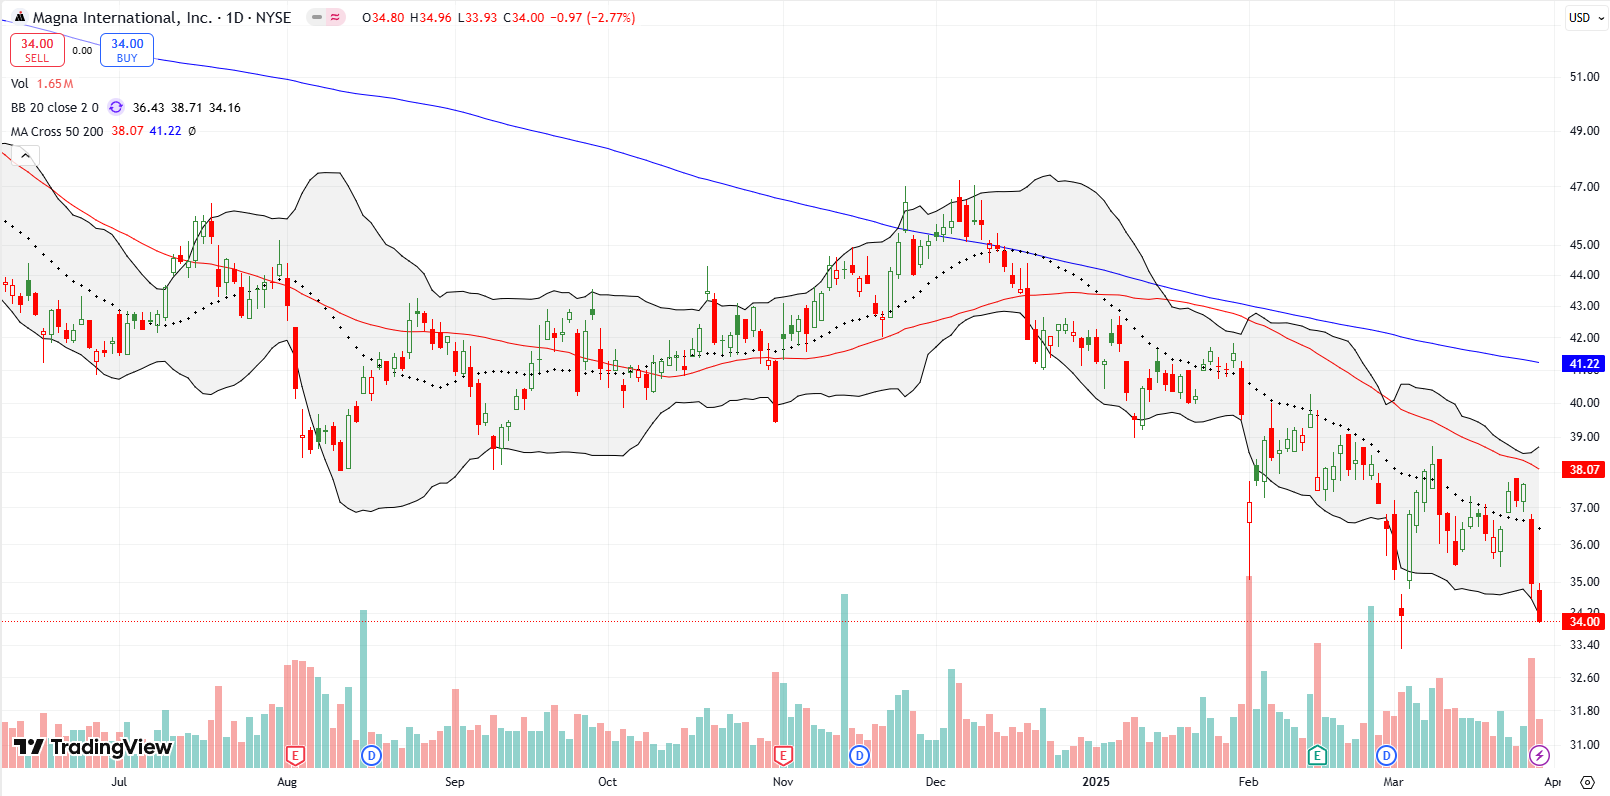
Auto parts company MGA dropped 7% after the announced auto tariff. This stock should have been on my list of shorts for Friday. I will look to fade the stock on rallies. MGA is slowly but surely approaching pandemic lows, reflecting a prolonged decline since its 2021 peak.
General Motors (GM)
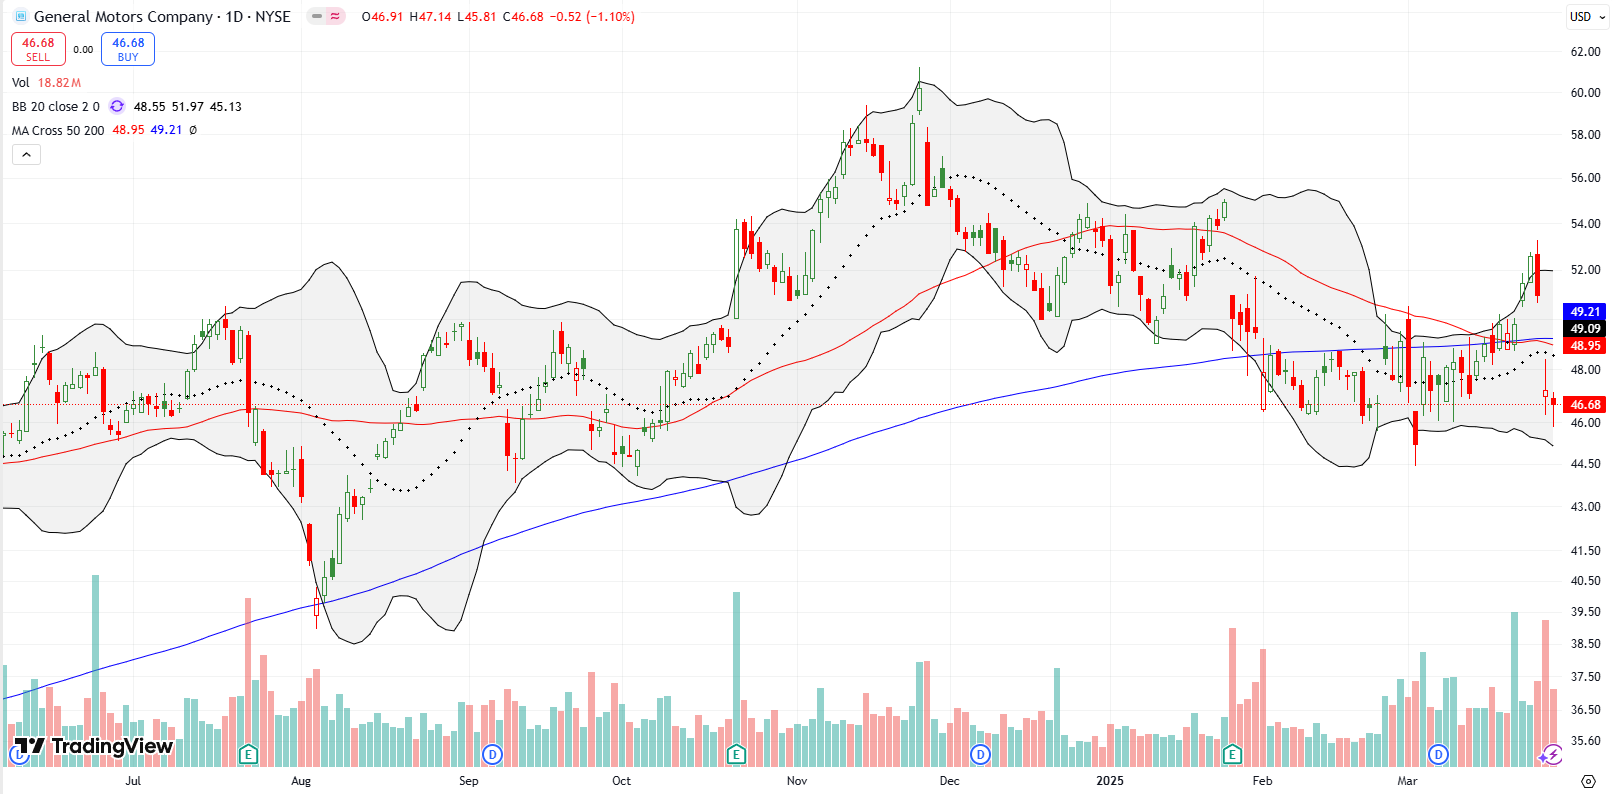
GM lost 7.4% in the wake of the auto tariffs. In a display of the market’s surprising on-going refusal to believe Trump’s seriousness about tariffs, GM actually rallied right into the tariff announcement minus a sharp 3.1% pullback just ahead of the announcement.
Ford (F)
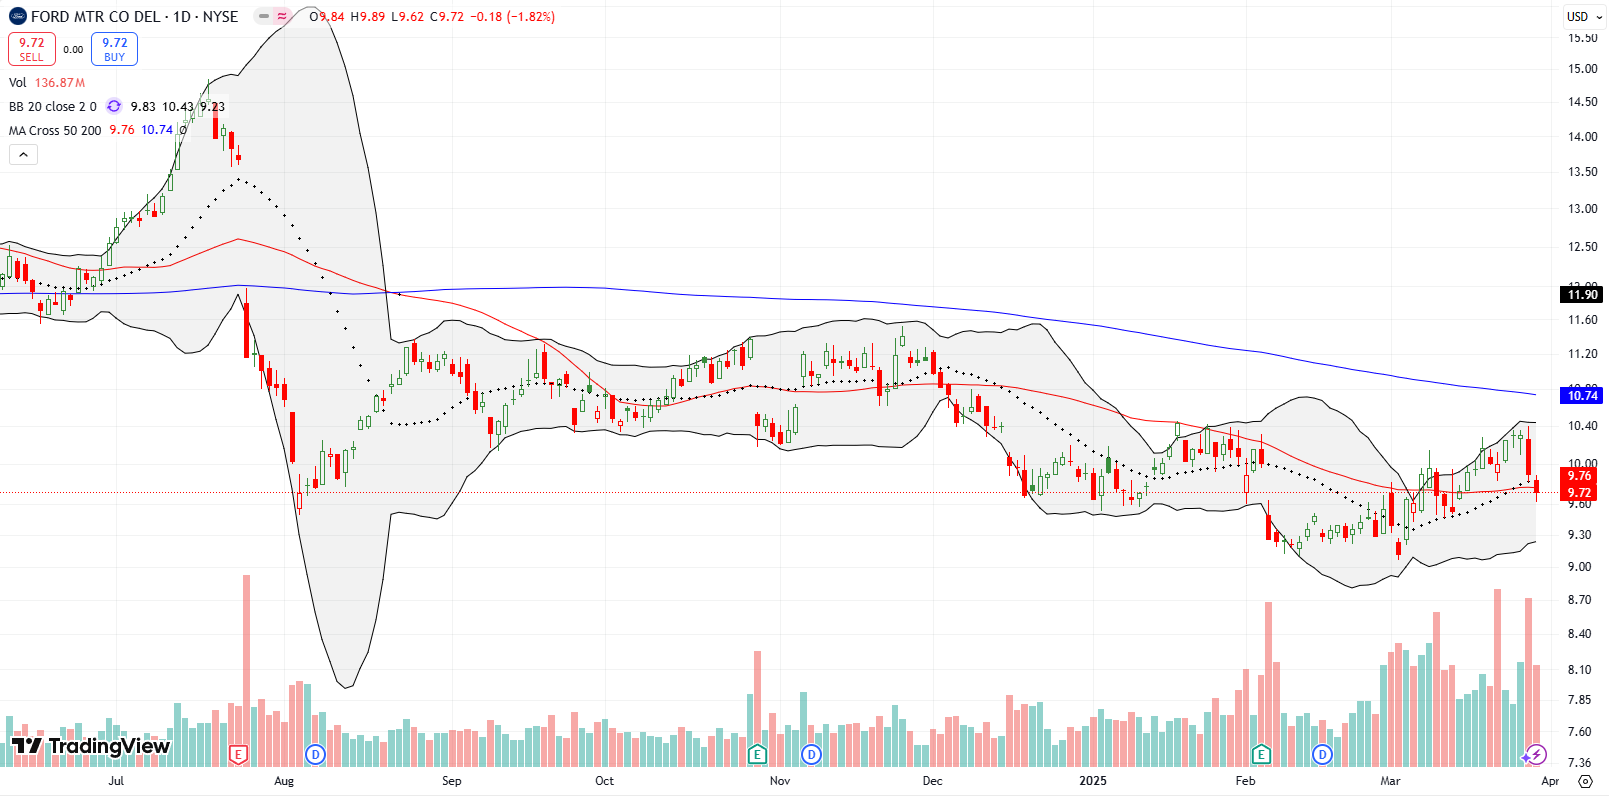
Ford did not fall as hard as GM, but it too rallied its way into the tariff announcement. The stock has suffered poor performance since its peak in early 2022. That pandemic-driven rally was a brief interruption in a downtrend in place since a 2010 peak which in turn was the end of a temporary relief rally form a downtrend in place since an all-time high in 1999.
Hertz Global Holdings (HTZ)
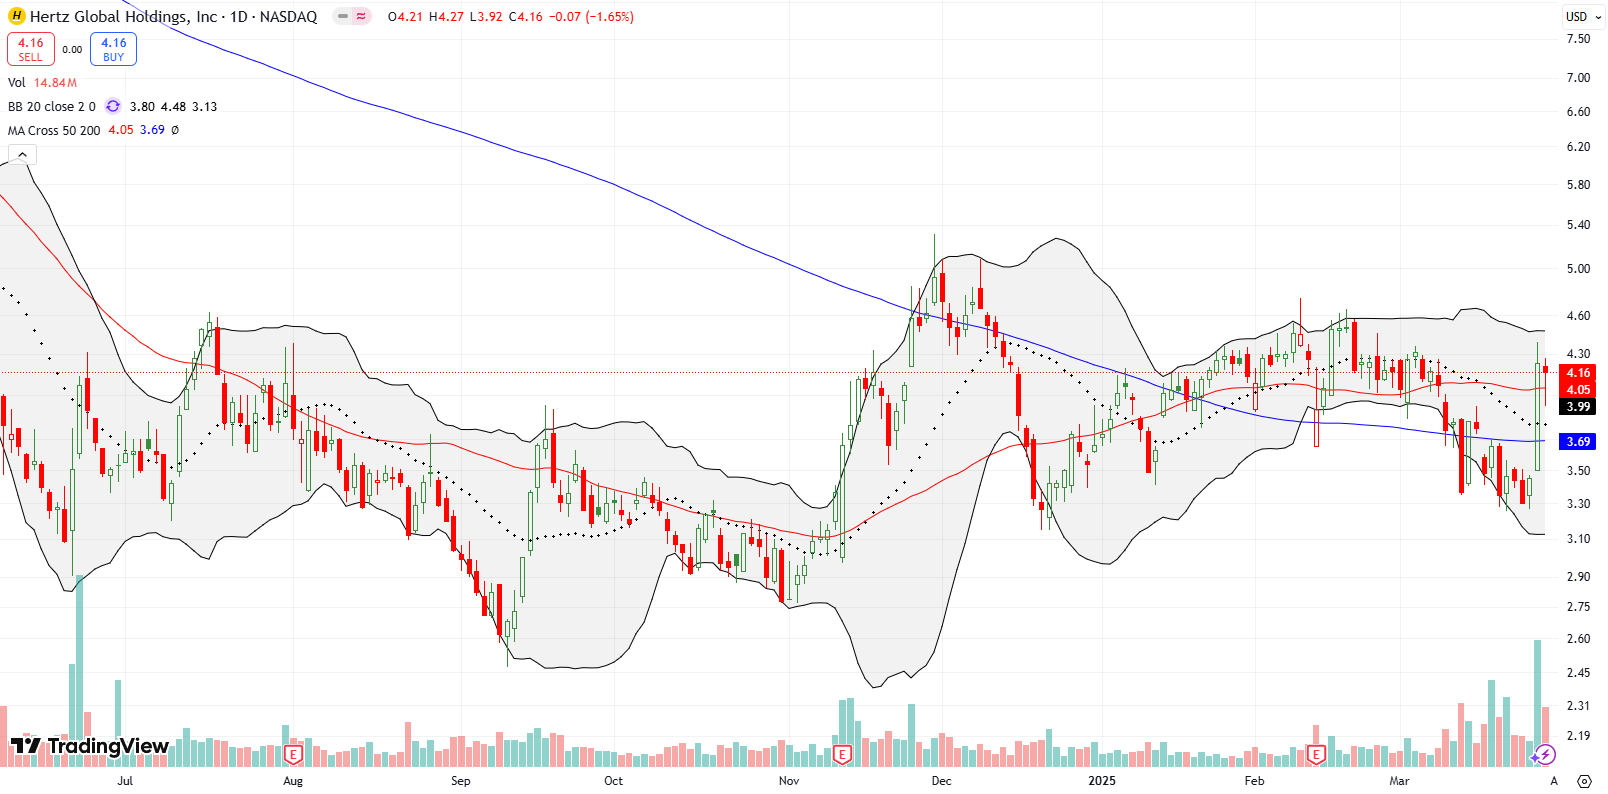
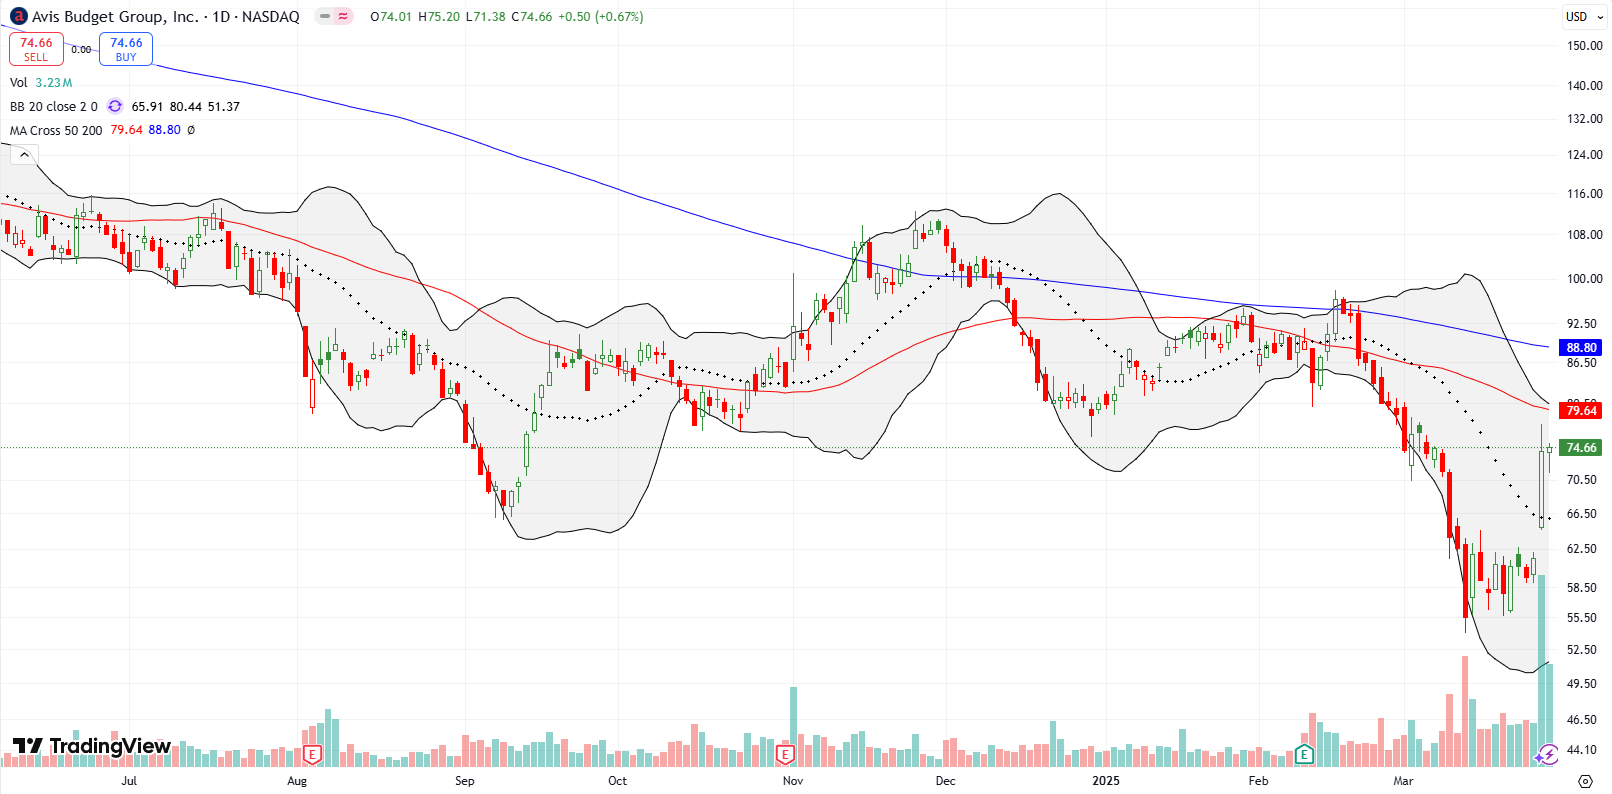
Rental car companies with used car fleets benefited from the tariff announcement. Presumably used cars will offer a better value compared to new cars slammed by tariffs. However, consumers will likely be surprised to find the used car sellers taking advantage of the price gap to raise their own prices. After all, their replacement costs are soaring. Thus, I am looking to fade the 22.6% surge in HTZ and the 20.6% surge in Avis Budget Group, Inc (CAR) as soon as sentiment looks like it is cooling off. Or maybe that cooling already started on Friday.
CarMax (KMX)
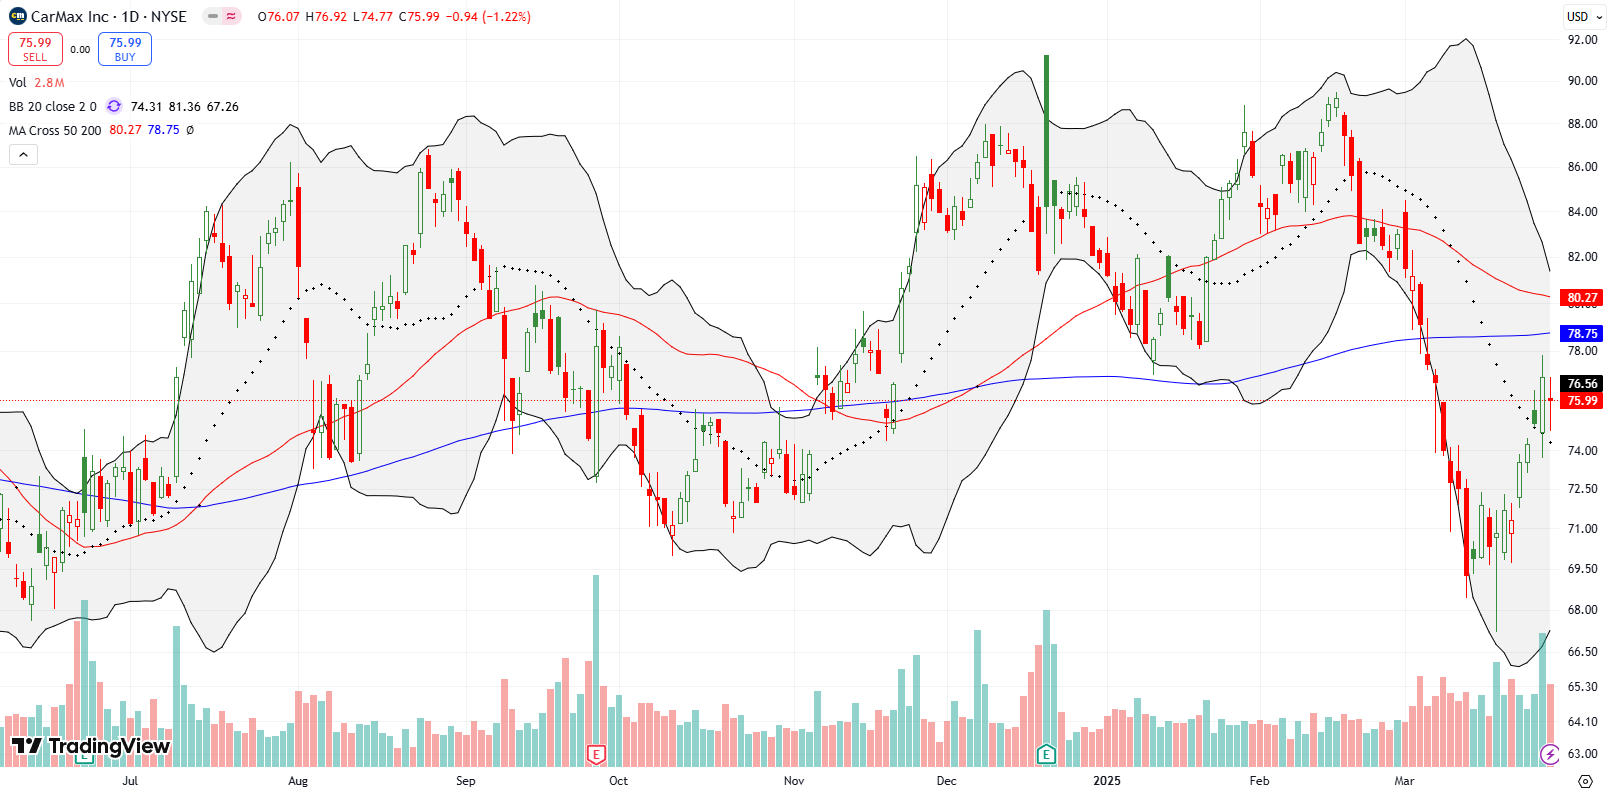
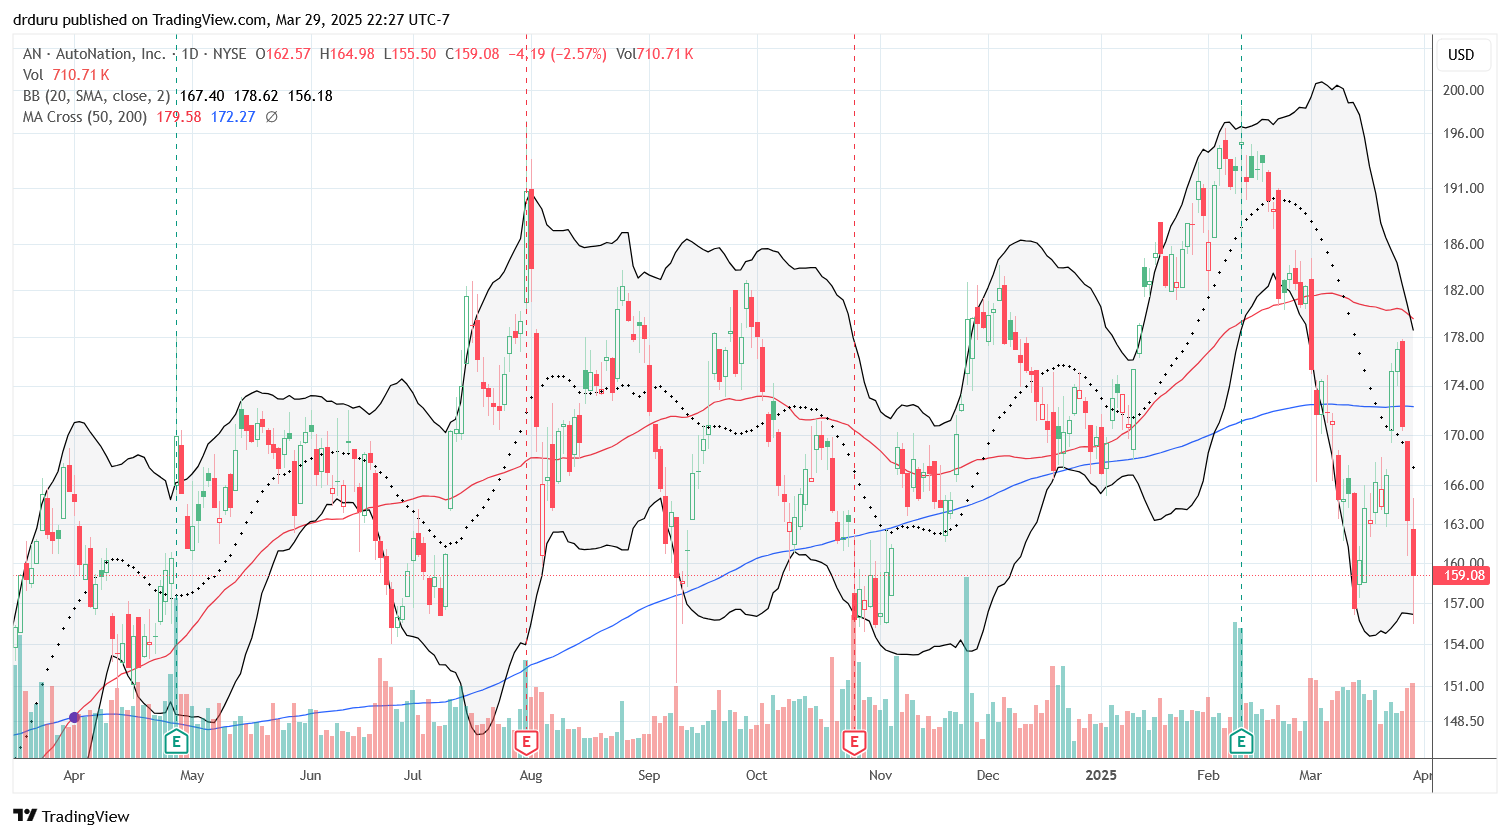
Used auto dealer KMX gained 2.5% after some initial indecision among traders. On the other hand, Autonation (AN) continued a sell-off that started Wednesday. I did not see any news to explain the slide.
JFrog Ltd (FROG)
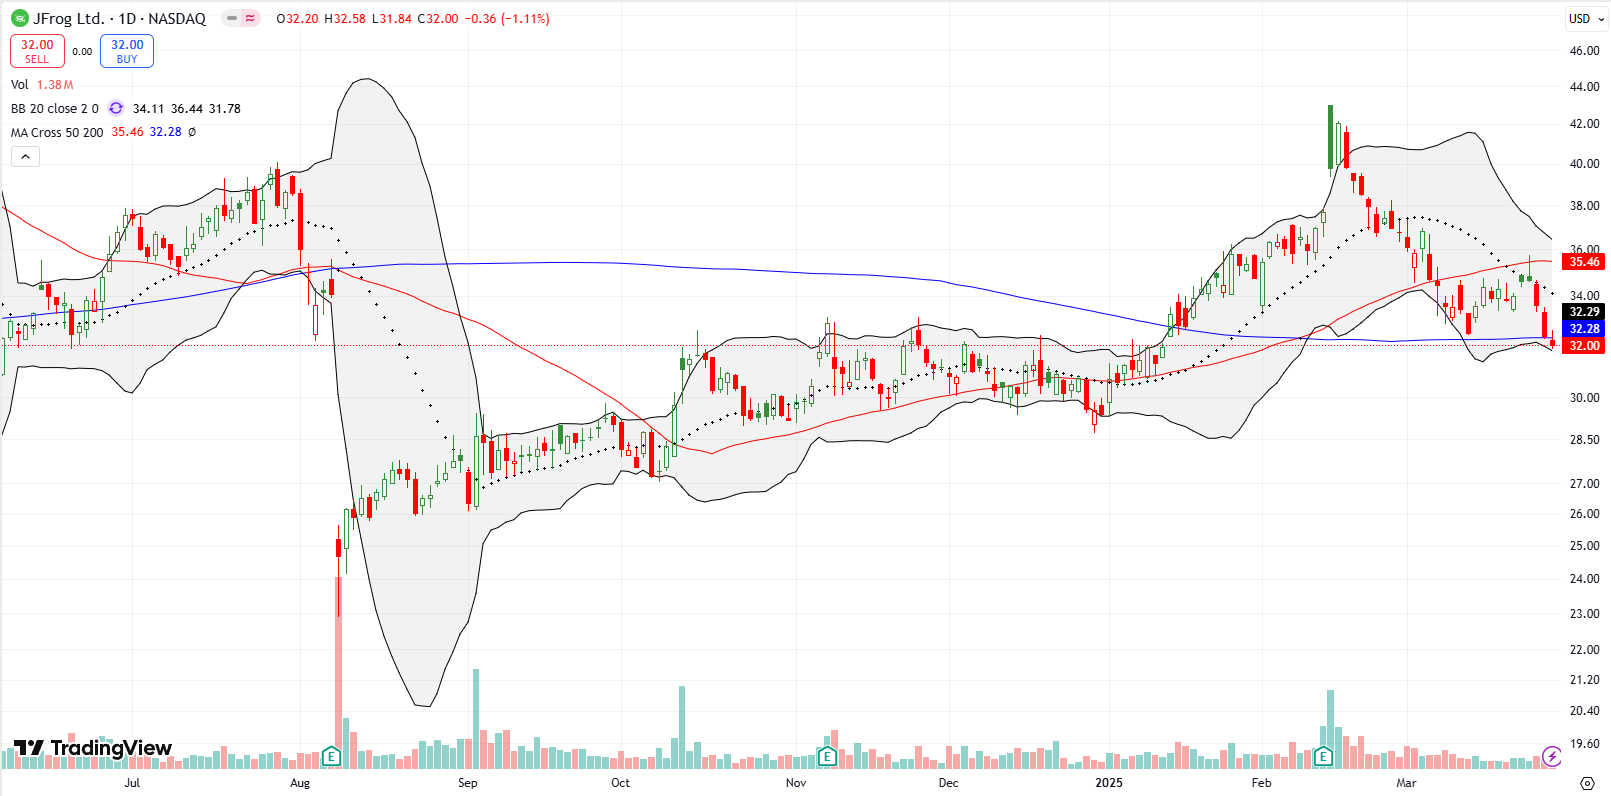
Software delivery platform FROG broke below its 200DMA, a bearish development. The stock is among several software stocks with strong initial post-earnings moves that quickly reversed. With those heady gains swiftly reversed, a breakdown carries extra risk as a confirming signal of a damaging turn-around in expectations for future business performance.
Broadcom (AVGO)
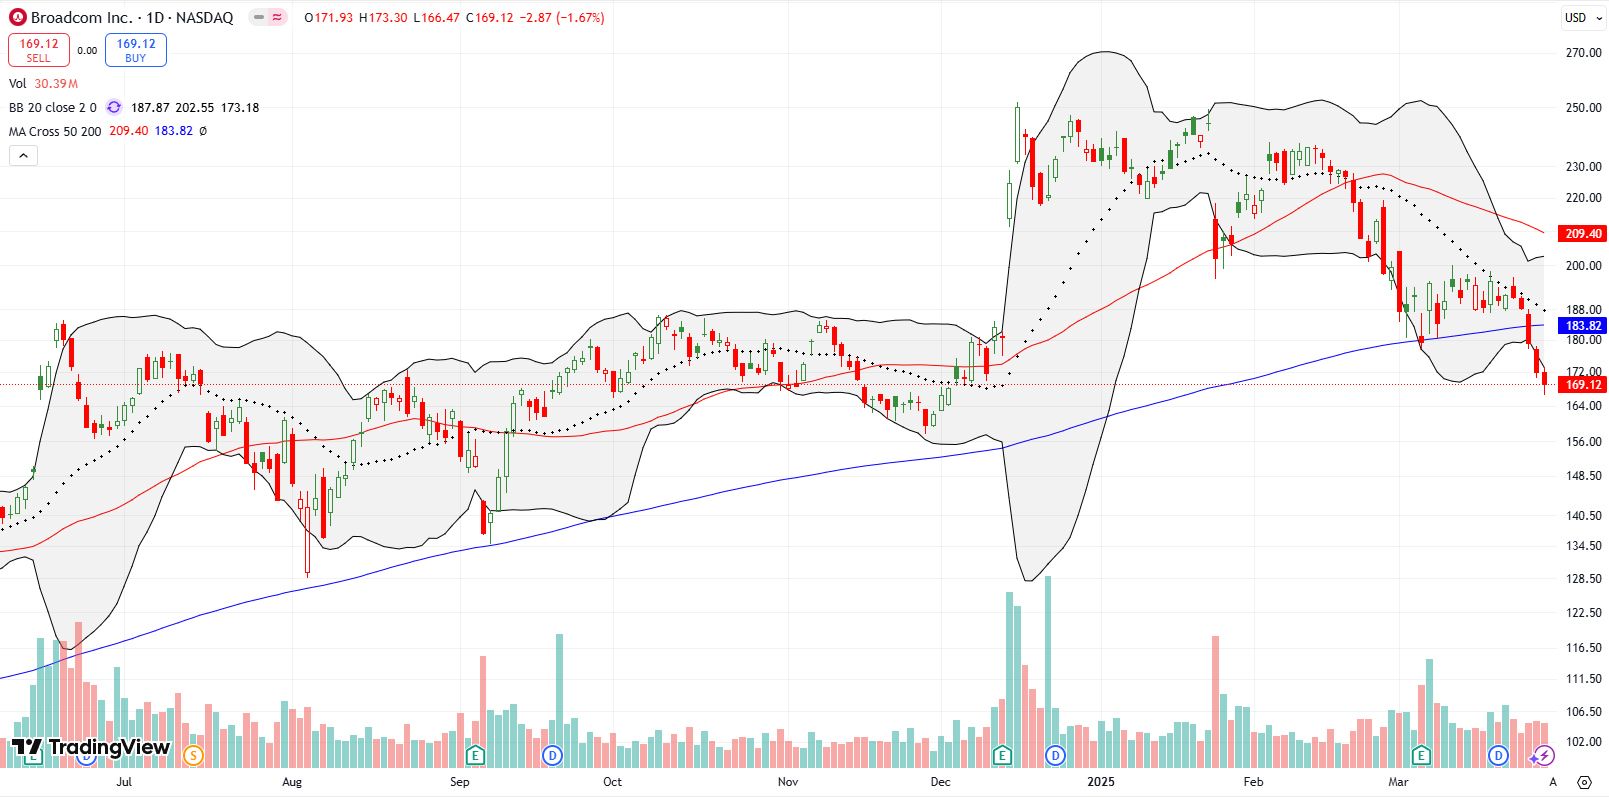
I bought semiconductor company AVGO on its post-earnings setup. Last week’s 200DMA breakdown invalidated the bullish signal on this AI trade, and I moved quickly to limit losses. AVGO now trades well below its pre-earnings close and is in danger of significantly deeper losses.
Lululemon (LULU)
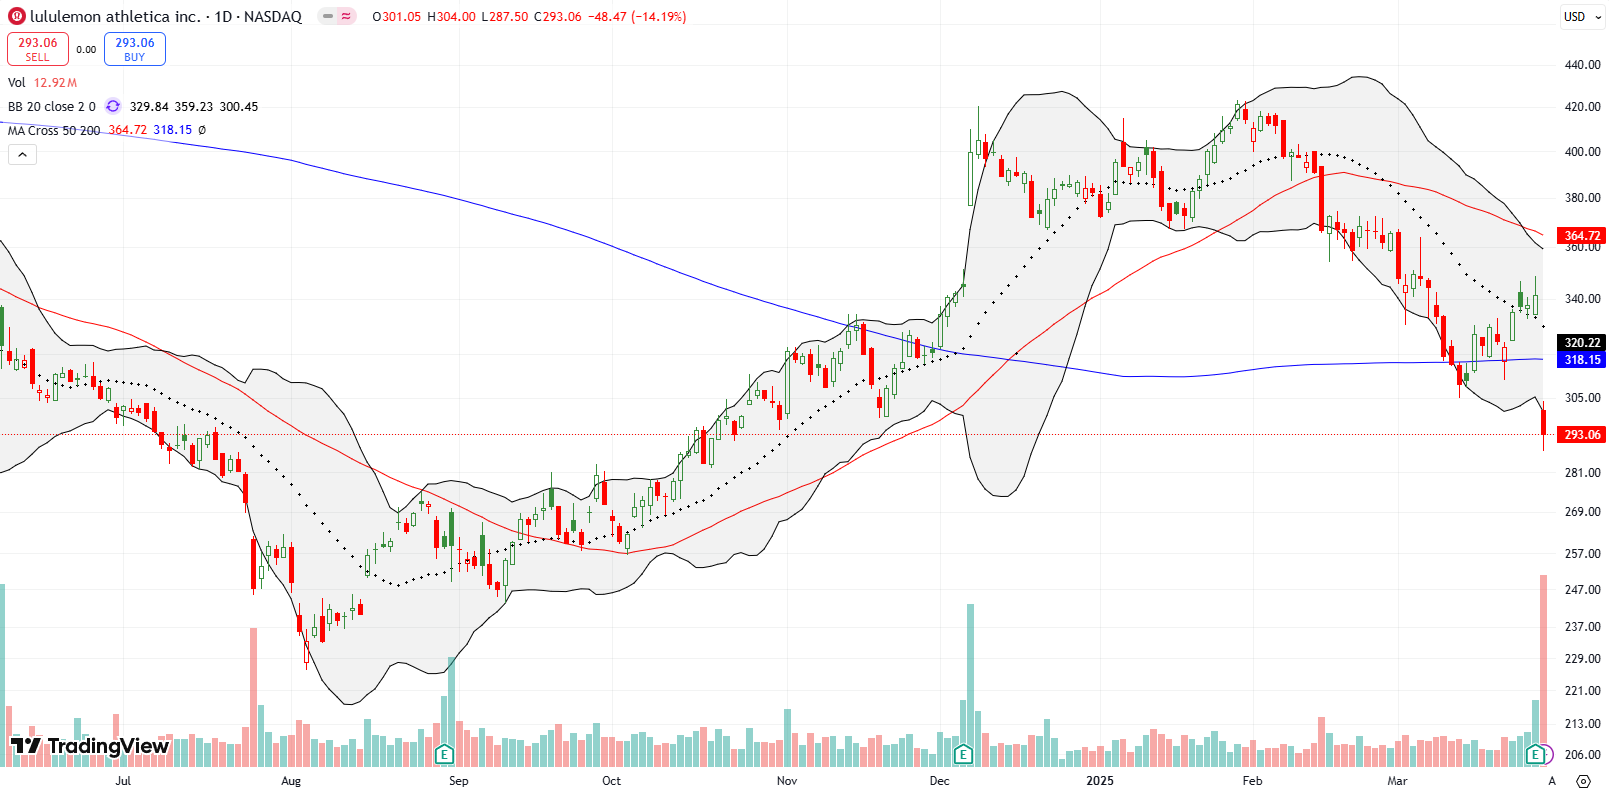
Athleisure retailer LULU fell 14% post-earnings and closed well below its 200DMA. Despite five years of range-bound trading, this premium retailer is again being discounted by the market. Last year, I bought into a technical turnaround for LULU but was unwilling to take a chance on December earnings. Now I am left wondering what all that excitement was about with that 15.9% post-earnings surge.
Delta Air Lines (DAL)
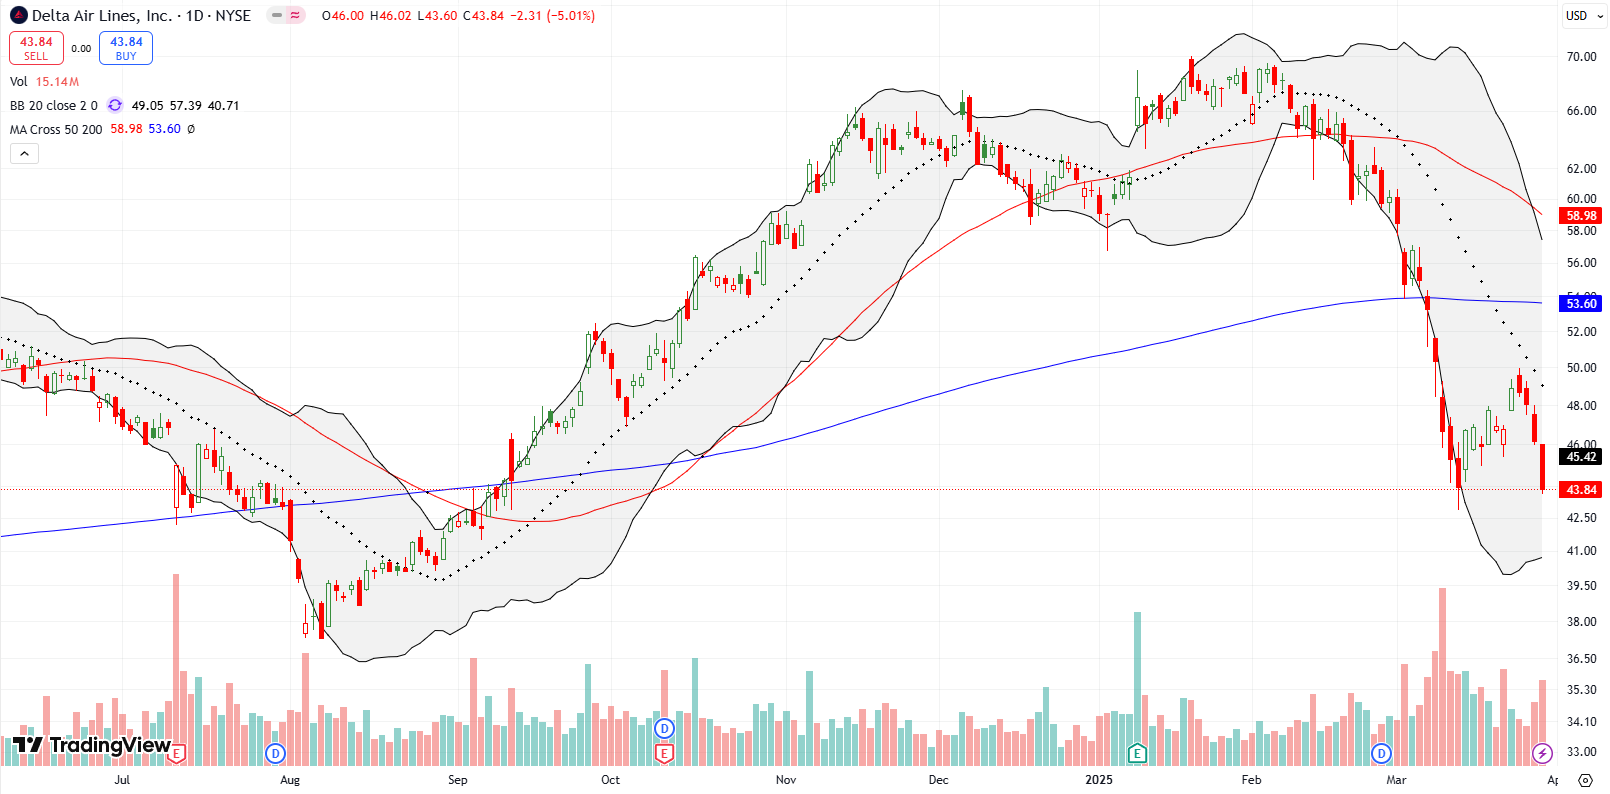
DAL sold off four straight days following poor guidance and confirmed 20DMA resistance. Given this selling completely reversed a rebound from poor earnings guidance, I expect the selling to continue, possibly toward the August low.
Vertiv Holdings, LLC (VRT)
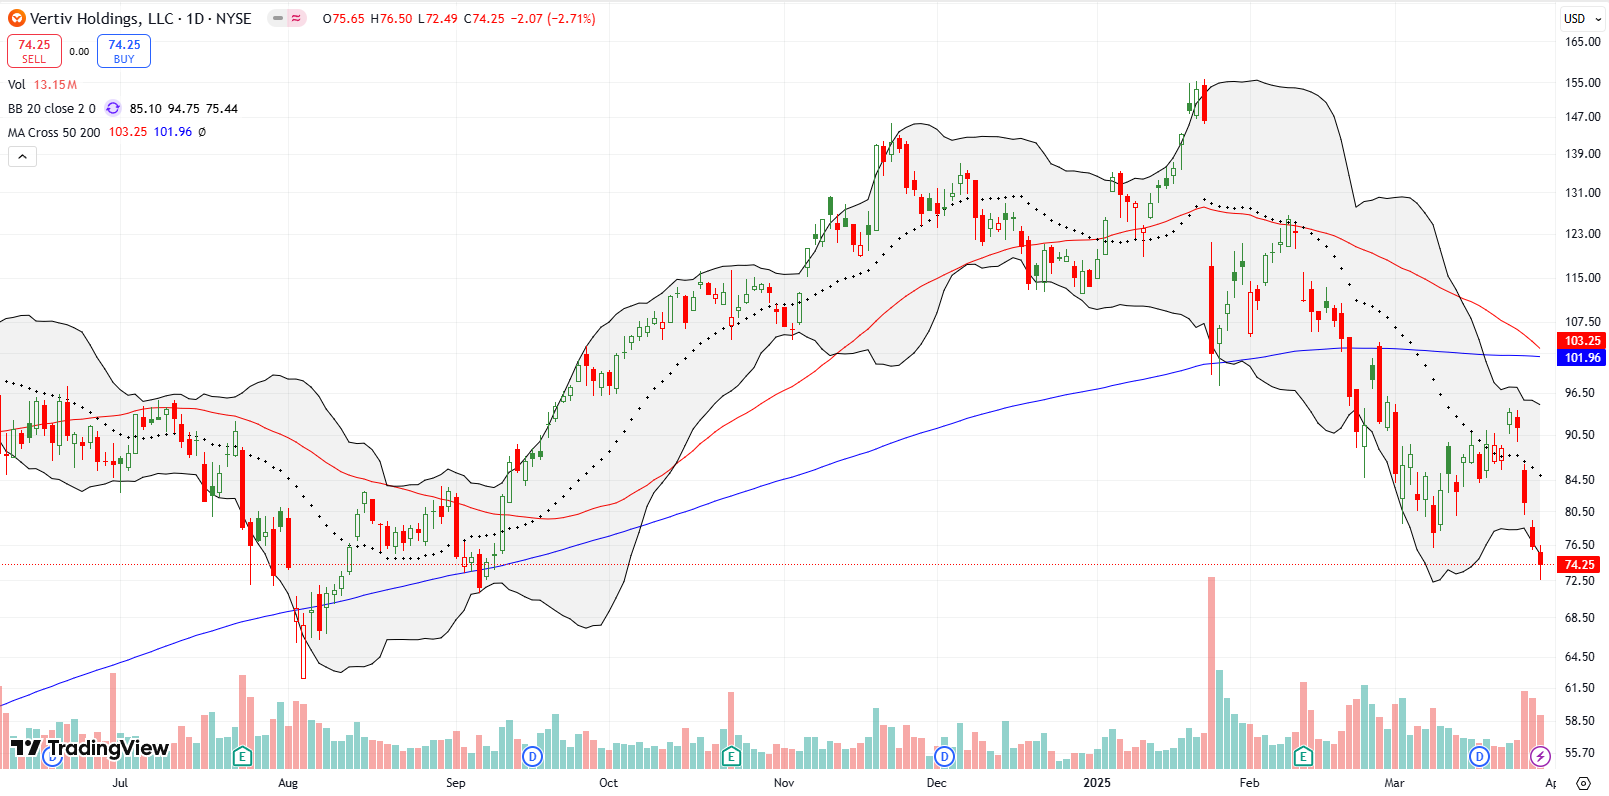
My favorite AI trade fully reversed a neat recovery and then some. VRT, along with the broader sector of AI-related stocks, was hit with a multitude of poor AI-related headlines. From a pullback in data center spending by Microsoft (MSFT) to fresh bans on tech exports to China, VRT dropped on every headline. Moreover, I heard last week ont he podcast “Risk Reversal” claims about margins falling across AI-related companies. I was hopeful for a test of converging resistance at the 50 and 200DMAs. Instead, VRT fell nearly straight down to its September lows. VRT now looks poised to test the intraday low from August.
Be careful out there!
Footnotes
Subscribe for free to get email notifications of future posts!
“Above the 50” (AT50) uses the percentage of stocks trading above their respective 50-day moving averages (DMAs) to measure breadth in the stock market. Breadth defines the distribution of participation in a rally or sell-off. As a result, AT50 identifies extremes in market sentiment that are likely to reverse. Above the 50 is my alternative name for “MMFI” which is a symbol TradingView.com and other chart vendors use for this breadth indicator. Learn more about AT50 on my Market Breadth Resource Page. AT200, or MMTH, measures the percentage of stocks trading above their respective 200DMAs.
Active AT50 (MMFI) periods: Day #323 over 20%, Day #1 under 30% (underperiod ending 4 days over 30%), Day #20 under 40%, Day #32 under 50%, Day #59 under 60%, Day #160 under 70%
Source for charts unless otherwise noted: TradingView.com
Full disclosure: long IWM call, long VRT, long SPY
FOLLOW Dr. Duru’s commentary on financial markets via StockTwits, BlueSky, and even Instagram!
*Charting notes: Stock prices are not adjusted for dividends. Candlestick charts use hollow bodies: open candles indicate a close higher than the open, filled candles indicate an open higher than the close.
* Blog notes: this blog was written based on the heavily edited transcript of the following video that includes a live review of the stock charts featured in this post. I used ChatGPT to process the transcript.

