Housing Market Intro and Summary
What happened in the housing market in March, 2025? The bear market deepened for housing related stocks as they fell off the edge of a deeper malaise. Growing economic warfare between the U.S. and the world and the resulting chaos is adding to housing woes along with the usual culprit of tight supplies of existing housing, high mortgage rates, low affordability, and higher costs. Tariffs in particular to threaten to increase costs for home building. Per the NAHB: “builders estimate a typical cost effect from recent tariff actions at $9,200 per home. Uncertainty on policy is also having a negative impact on home buyers and development decisions.”
For March, sentiment declined while housing data rebounded slightly across various metrics:
- Home builder stocks fell deeper into bear market territory as home builders reported deteriorating earnings results.
- Home builder sentiment fell to a 5-month low alongside a plunge in consumer confidence. The sentiment on the “Traffic of Prospective Buyers” fell to a 15-month low.
- Single-family housing starts declined year-over-year but managed to reach an 11-month high.
- New single-family home remained trapped in a two-year trading range in sales.
- Existing home sales surprisingly rebounded sharply with the National Association of Realtors predicting a robust year of sales. Pending home sales bounced off all-time lows.
- California’s existing home market contributed to the strong national performance.
- According to a U.S. News and World Report survey, four in five home buyers are waiting for mortgage rates to drop before buying a home in 2025.
- Mortgage rates drifted slightly higher for the month while new home mortgage purchase applications dropped significantly year-over-year for the second month in a row.
Housing Stocks
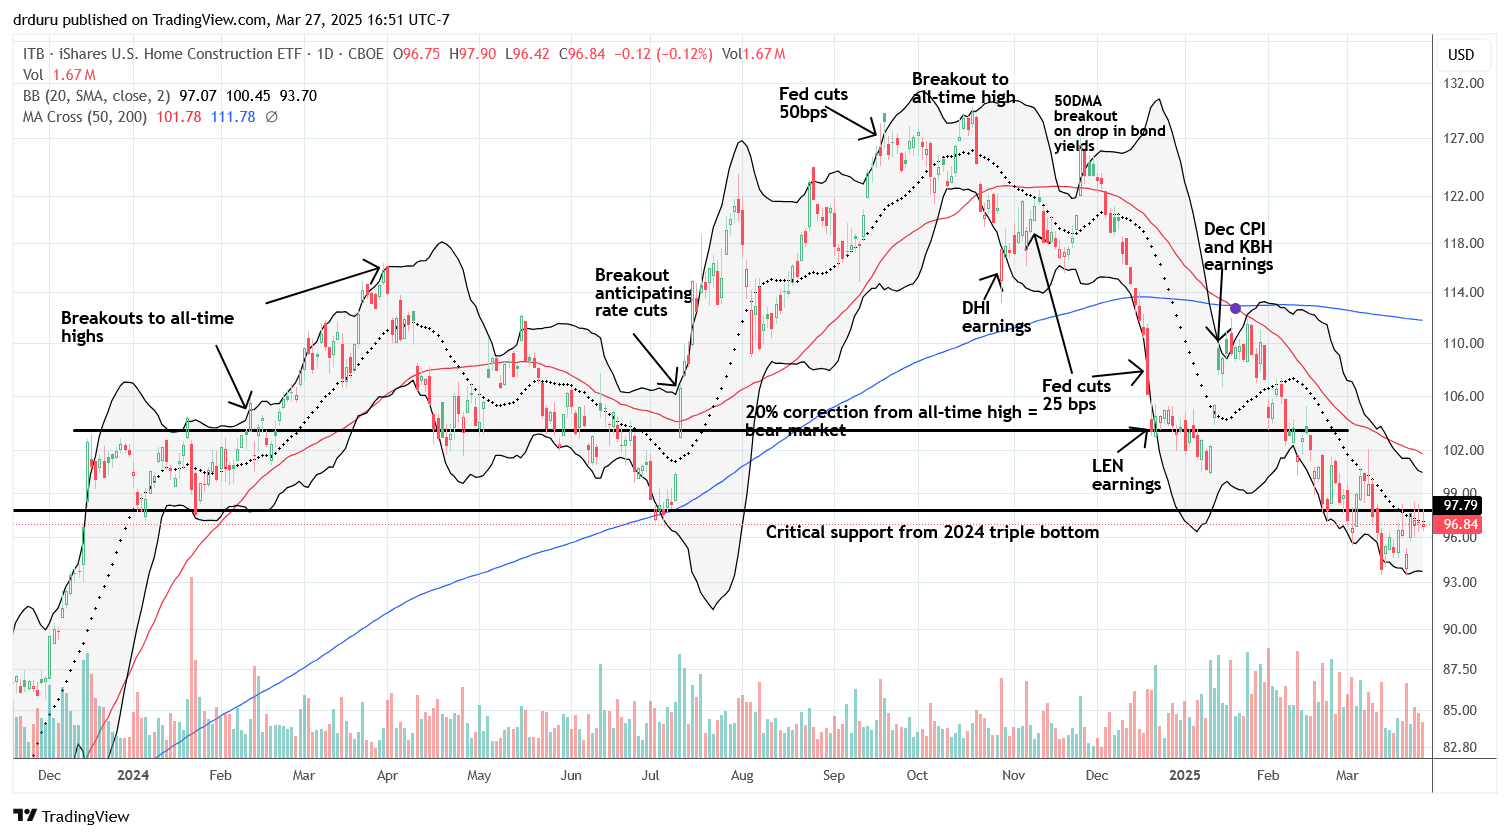
The iShares US Home Construction ETF (ITB) sold off for all of February and re-entered bear market territory. After a sharp 2-day (bear market) rally in early March that lifted ITB off the edge of a deeper malaise, ITB resumed its slide. The ETF of housing related stocks recovered along with the rest of the market but now struggles at resistance formed by its 2024 lows. The price action has further validated the bear market in housing I have written about for the past few months. This year’s seasonal trade on home builders was practically dead on arrival with the October peak at all-time highs, and it looks like an extended bear market for housing is well underway. ITB is 25% off its all-time high.
Ironically, the next major catalyst for builders will need to come from the U.S. Federal Reserve in the form of significant rate cuts in the wake of broader economic weakness.
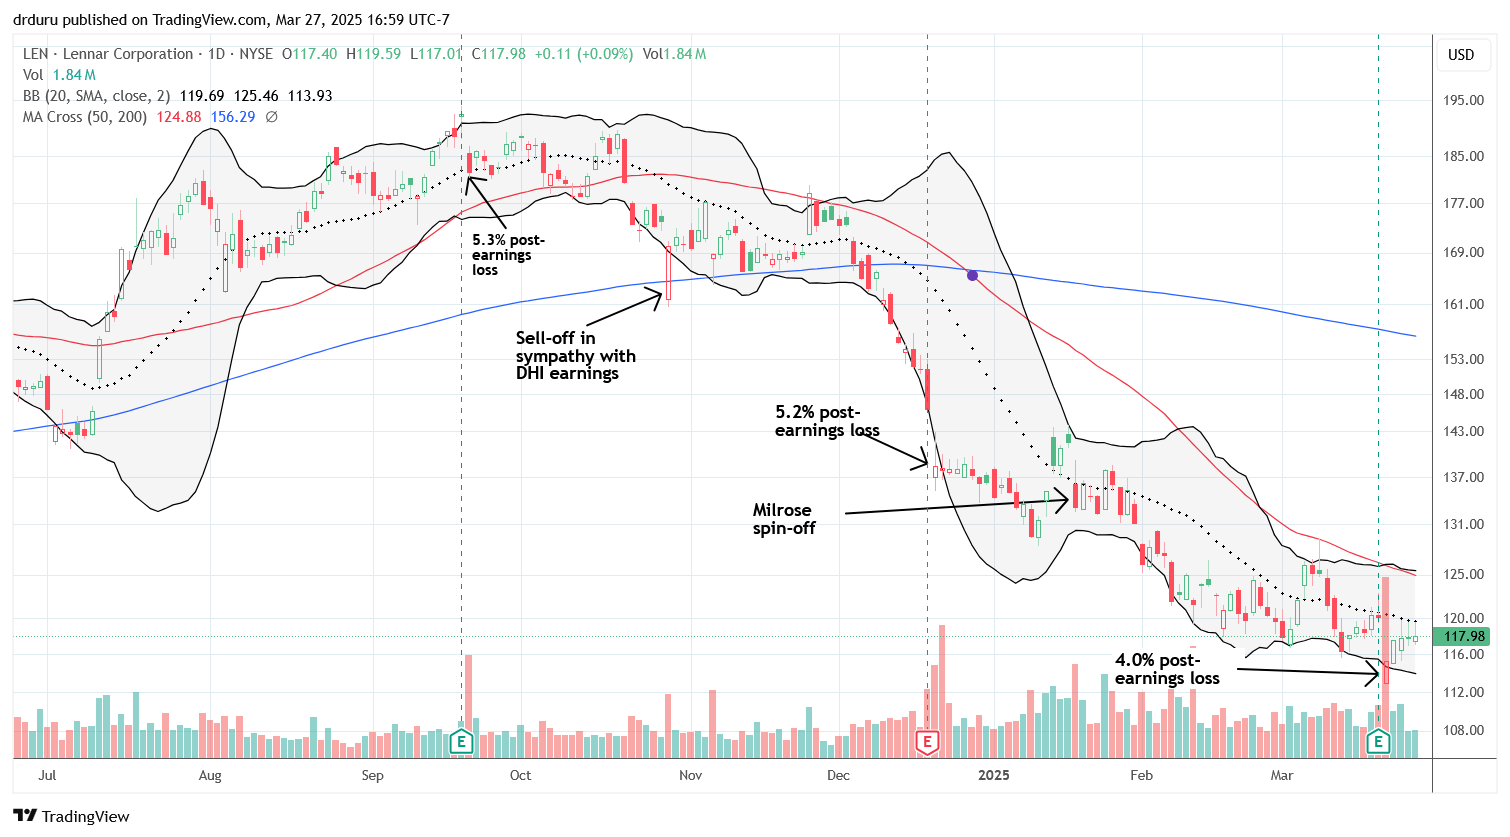
Lennar Corporation (LEN) reported earnings last week and provided further validation of the housing market’s bear market. While the company strives to maintain production and sales volumes, it is paying the price with lower margins. Margins are a big deal in analyst ratings of the stocks of home builders, so I am not surprised that LEN fell to a 16+ month low following earnings. I see little near-term upside for LEN beyond the occasional bear market rally.
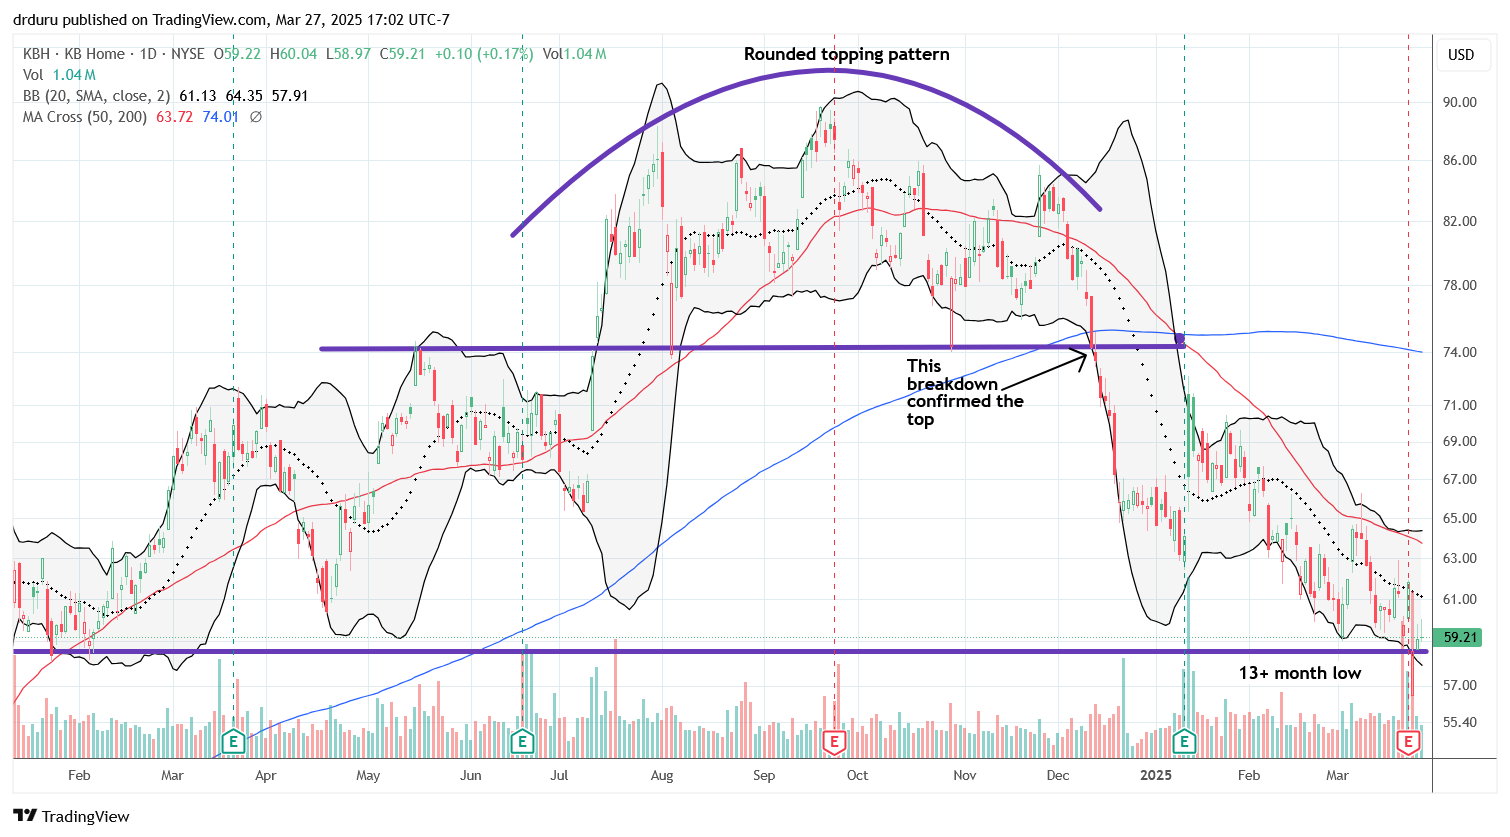
Like many builders, KBH Home (KBH) telegraphed its troubles with a topping pattern in the stock price. The chart below shows the setup and the fateful breakdown. Like LEN, KBH earnings this week further validated the bear market in housing. The company nudged guidance lower for revenues and earnings. This double delivery of bad news took the stock to a 13+ month low. The tepid rebound from the post-earnings lows make me expect imminent lower lows.
The builders have habitually remained eternally optimistic in the face of poor market conditions. This time around I strongly expect a builder in the coming one or two earnings cycles to deliver significantly lower earnings guidance.
Housing Data
Home Builder Confidence: The Housing Market Index – March, 2025
In January, the National Association of Home Builders (NAHB)/Wells Fargo Housing Market Index (HMI) managed to nudge higher by a point to 47 after spending two months at 46. Subsequently, the bottom fell out with a 5-point plunge in February and another 3-point drop in March. The NAHB once again blamed tariffs for weighing down sentiment. The organization noted that economic uncertainty and “elevated construction costs” are coming along for the ride with tariffs: “Builders continue to face elevated building material costs that are exacerbated by tariff issues, as well as other supply-side challenges that include labor and lot shortages.
The dynamics among the HMI components were part of my conclusion that HMI was topping out. Once divergent, the components are each trending downward. Most telling this month and for the spring selling season, the components “Single-Family: Present” and “Traffic of Prospective Buyers” fell to 15-month lows. These components caught up to the plunge in “Single-Family Detached Next 6 Months.”
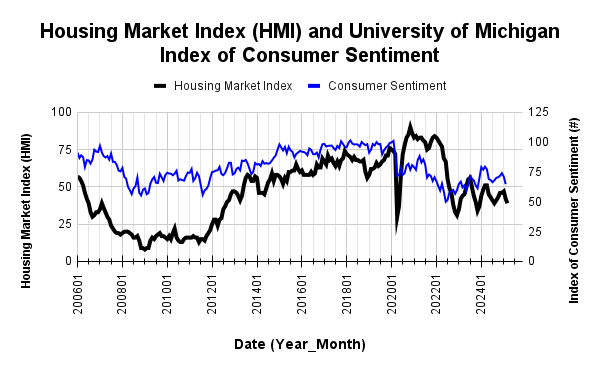
Source for data: NAHB and the University of Michigan
Consumer sentiment is now plunging alongside plunging builder confidence.
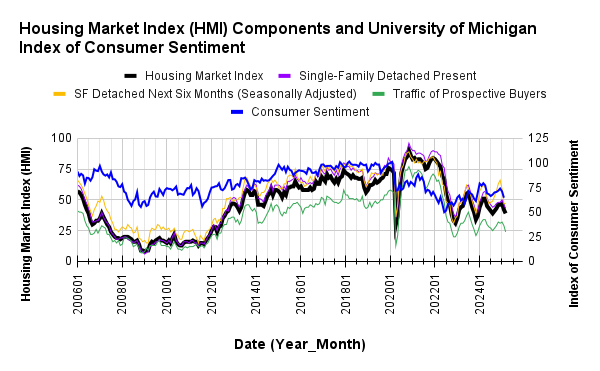
Pricing power for builders seemed to slip slightly. The 29% share of builders cutting prices is up from February’s 26%. The share of builders providing incentives stayed flat month-over-month at 59%. The average price discount was flat once again at 5%.
Divergences in the regional HMIs earlier made me expect a topping out in the aggregate HMI. For February and March, each of the four regions dropped. The Northeast continued to tumble from its 9-month high of 65 (set in January) to 47, a 7-month low. This region was the last region to hold above the 50 threshold. The Midwest plunged from 43 to 38. The South dropped 2 points to 39. After a steep plunge in February, the West slipped just one point to 34.
New Residential Construction (Single-Family Housing Starts) – February, 2025
Suddenly, single-family housing starts are diverging from builder sentiment. Starts are now holding the line at the 1M mark and have generally trended upward since the trough last summer. The NAHB suggests that this trend is part of the process of filling the void left by a frozen existing home market. The 993,000 starts were 11.4% above January’s 995,000 (revised up from 993,000) yet still down 2.4% year-over-year.
![Housing starts US. Bureau of the Census, Privately Owned Housing Starts: 1-Unit Structures [HOUST1F], first retrieved from FRED, Federal Reserve Bank of St. Louis, March 18, 2025](https://drduru.com/onetwentytwo/wp-content/uploads/2025/03/20250318_Housing-starts-February-2025.png)
Building permits declined slightly for the second month in a row. Permits are down 3.4% year-over-year.
The Midwest was the only region with a (large) sequential decline in starts. The Northeast experienced a surge in starts (+75%). The year-over-year changes were 50/50. The Northeast, Midwest, South, and West each changed +2.4%, -34.9%, -3.3%, and +20.3% respectively year-over-year. I previously thought the November starts augured poorly for the spring selling season, and December starts brought a sliver of hope. January’s weak starts reaffirmed my subdued expectations. Now stepping back I can see the potential for an elongated spring selling season with lower monthly volumes.
New Residential Sales (Single-Family) – February, 2025
A wide range continues to unfold for new residential single-family sales. Since, November 2022, new home sales have bounced between 595K and 741K. February marked an uptick in this cycle with sales increasing from 664K (upwardly revised from 657K) to 676K, a 1.8% sequential increase. Sales also increased 5.1% year-over-year. While spring sales continue to provide a modicum of relief, I still see no catalysts on the horizon to break out to the upside. Spring still presents more downside than upside risks.
![new home sales US. Bureau of the Census, New One Family Houses Sold: United States [HSN1F], first retrieved from FRED, Federal Reserve Bank of St. Louis, March 26, 2025](https://drduru.com/onetwentytwo/wp-content/uploads/2025/03/20250326_New-home-sales-February-2025.png)
For February, the median price for new homes dropped 3.0% sequentially and 1.5% year-over-year. A very slow and choppy downtrend is unfolding from the all-time high in October, 2022. As with many of the prior swings, February’s price swing was driven by notable changes in sales mix.
For December, sales migrated to the $500,000 to $999,999 range. The book-ending tiers each lost share. In January, there was a sharp shift to the middle of the price curve with $400,00 to $599,999 collectively gaining 7 percentage points, and homes over $1M gaining a percentage point. For February, the $300,000 to $399,999 range was the only tier to gain share (from 27% to 34%). Thus, this share gain explained the entire sequential price drop for the median price. Year-over-year, the $300,000 to $499,999 range gained all but one percentage point of the share gains, thus explaining the more muted year-over-year decline in the median price.
February’s inventory declined slightly from January’s 9.0 (unrevised) to 8.9 months of sales. For comparison, a year ago inventory sat at 8.4 months of sales. Absolute inventory continues to rise sharply after remaining flat for most of 2024. Absolute inventory was last this high 17+ years ago. Note that overall inventory, new plus existing homes, remains below historical norms at 4.2 and flat with January. Inventory should be a key story in 2025 as the housing market teeters on its next leg lower in activity.
The regional year-over-year sales changes were very mixed and divergent with the South finally leading again, and by a wide margin. The Northeast, Midwest, South, and the West changed -48.8%, +2.7%, +19.0%, and -11.4% respectively.
Existing Home Sales – February, 2025
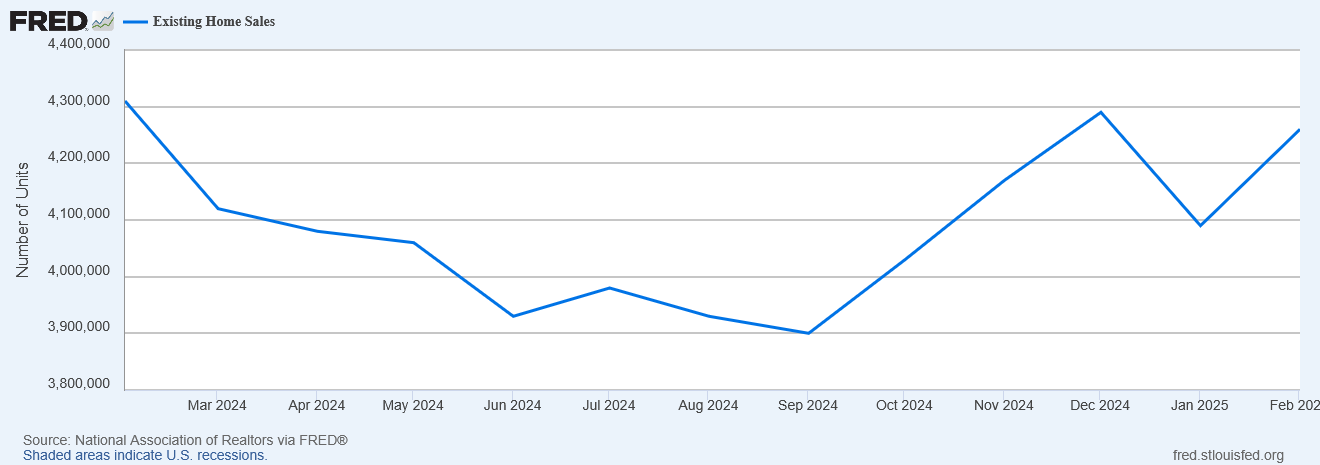
In October, existing home sales jumped sharply off 14-year lows for the first year-over-year gain in over 3 years. January’s sharp sequential loss threatened to take existing home sales right back to those lows. While January existing home sales decreased 4.9% sequentially to 4.08M, February’s sales rebounded 4.2% to 4.26M. However, sales declined year-over-year by 1.2% (accounting for the leap year in 2024 as well as standard seasonal factors), ending a four-month streak of annual gains. Thus, this surprise sequential rebound carries mixed messages, especially considering pending home sales fell to a record low in January and rebounded slightly by 2% in February.
(For historical data from 1999 to 2014, click here. For historical data from 2014 to 2018, click here) Source for chart: National Association of Realtors, Existing Home Sales© [EXHOSLUSM495S], retrieved from FRED, Federal Reserve Bank of St. Louis, March 20, 2025

Sales of existing single-family homes rebounded with an increase in inventory. While the correlation has proven weak in recent years, the NAR took this opportunity to point out “…more inventory and choices are releasing pent-up housing demand.” The NAR reported February inventory at 1.24M, a 5.1% increase month-over-month and up 17.0% year-over-year. According to the NAR, “Unsold inventory sits at a 3.5-month supply at the current sales pace, unchanged from January but up from 3.0 months in February 2024.” The months of supply and absolute inventory have now increased for two consecutive months, and I expect the general trend to point upward for this spring selling season.
Once again, the changes in inventories and sales did not stand in the way of the relentless upward price trend. Year-over-year pricing jumped again despite the surge in year-over-year inventories. The median sales price of an existing home hit an all-time high at $426,900 in June. February’s median price increased 1.3% sequentially to $398,400 and increased 3.8% year-over-year. This 19th straight year-over-year increase represents the relentless march grinding away at affordability in the market. The sequential gain was the first increase since October, 2024 (.02%) and first substantial increase since June, 2024 (2.3%).
The NAR took the side of existing home owners when describing this relentless price appreciation (this is the second or third time in the past year):
“Each one percentage point gain in home price translates into an approximately $350 billion increase in housing equity for American property owners…That means a gain of nearly $1.3 trillion in home value appreciation at a time when the current stock market is undergoing a correction. Moreover, the ongoing housing shortage, coupled with historically low mortgage default rates, implies a solid foundation for home values.”
Of course buyers sit on the other side of these market dynamics while facing ever increasing affordability pressures. The NAR pointed out affordability issues in its previous report.
The average time on the market for an existing home increased to 42 days in February, a slight increase from 41 days in January and a jump from 38 days a year ago. If inventory is on a sustained uptrend, then time on market should also continue trending higher as buyers have more options to consider.
The share of sales going to first-time home buyers resumed upward momentum. These sales increased from a 28% share in January to 31% in February, flat with a year ago. The NAR’s 2017 Profile of Home Buyers and Sellers reported an average of 34% for 2017, 33% for 2018, 33% for 2019, 31% for 2020, 34% for 2021, 26% for 2022, 32% for 2023, and a plunge to an all-time low of 24% in 2024.
The West was a large contributor to sequential sales gains with a 13.3% surge from January with a substantial portion of those gains coming from California (see below). Following a flat performance in January, the South was a large drag on year-over-year sales. The regional year-over-year changes were: Northeast +4.2%, Midwest +1.0%, South -4.0%, West 0.0%.
Single-family existing home sales increased by 5.7% from January to 3.89M in February and decreased by 0.3% year-over-year. The median price of a single-family home was $402,500, up 3.7% year-over-year and increased 1.1% month-over-month.
California Existing Home Sales – February, 2025
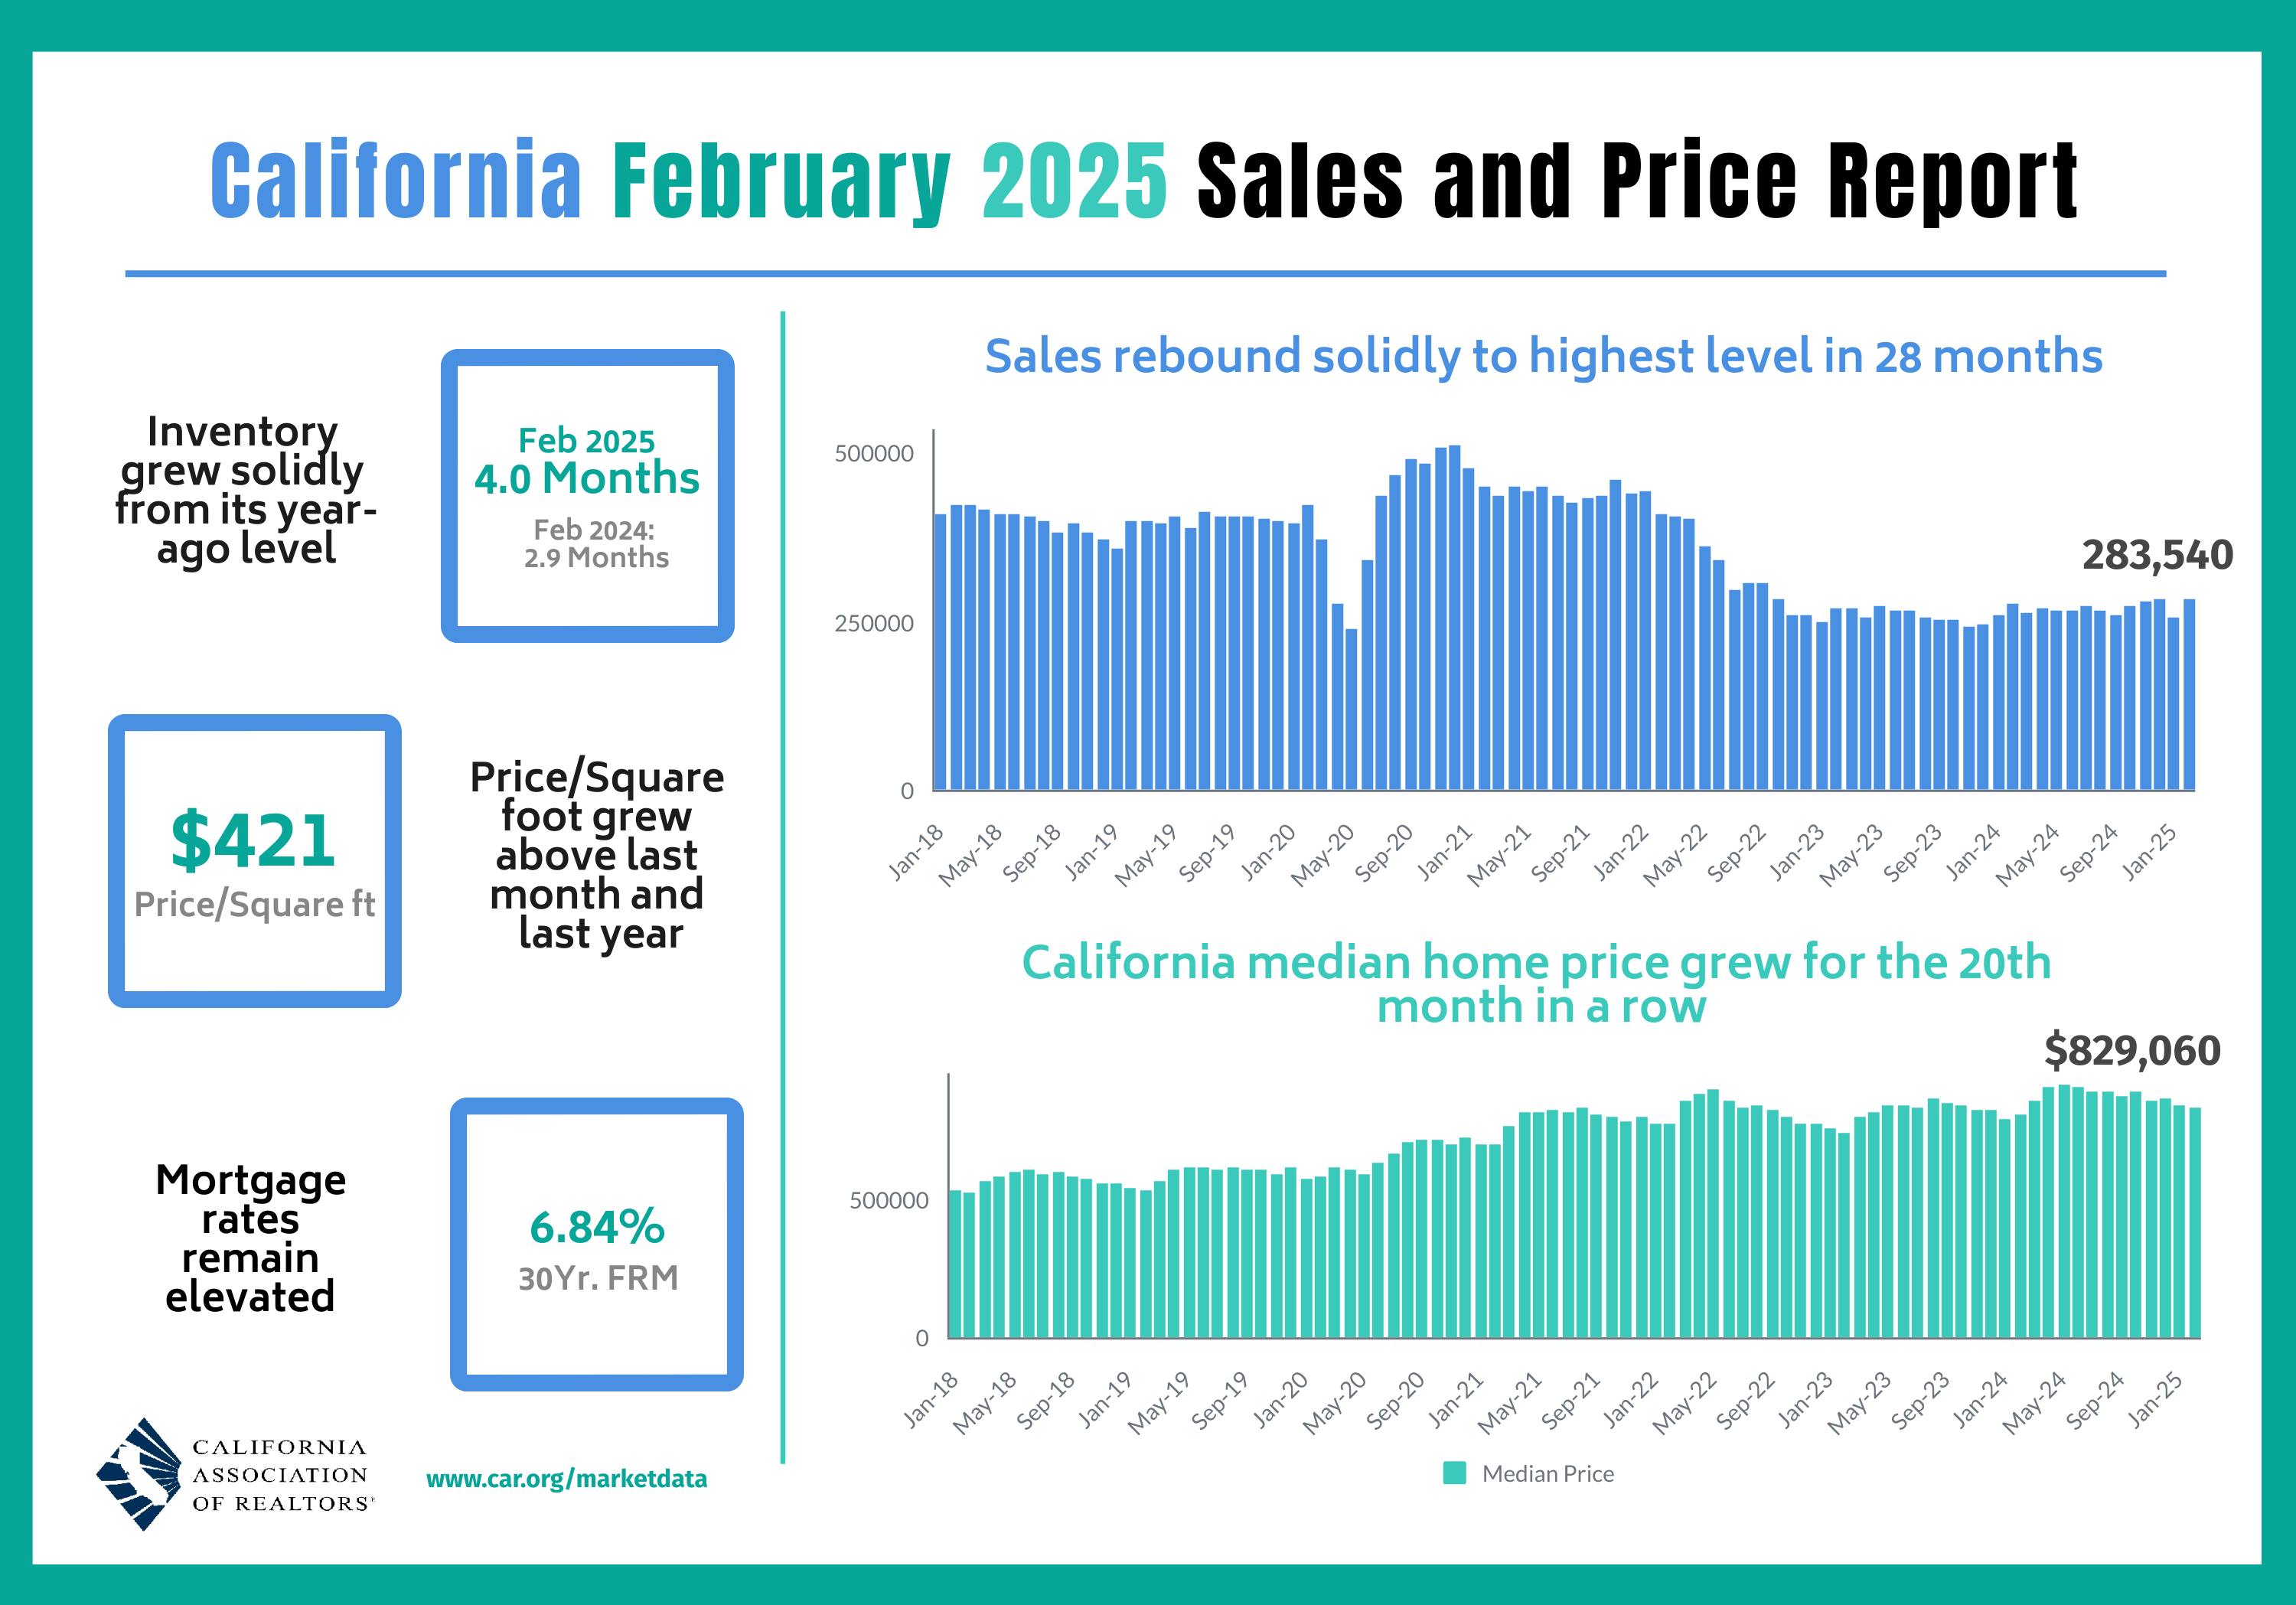
A month after California’s existing home sales plunged 10.0% month-over-month, sales surged 11.6% from January to February to 283,564, apparently thanks to a greater availability of homes. Sales also increased 2.6% year-over-year off the 13-year low to a 2-year high. While the median price also decreased from January by 1.2%, prices still moved higher year-over-year for the 20th month in a row (2.8%). The median price per square foot also increased 3.4% year-over-year. The C.A.R. took some solace from the smallest year-over-year gain since July, 2023 but still acknowledged that “the downward trend in the statewide median price will likely reverse in the coming months, however, as home prices typically begin rising in March and continue climbing until the end of the homebuying season in August.”
California’s housing supply continues to expand. In December, active listings dipped for the first time in 12 months, but in January they surged to a 5-year high. In February, they “grew at the fastest pace in two years”, hit a 4-month high, and recorded a 13th straight month of year-year gains. New active listings grew at a double-digit pace for the second month but declined sequentially for the first time in 5 years. The C.A.R. speculated this decline is an anomaly.
The Unsold Inventory Index (UII) (the number of months needed to sell the supply of homes on the market at the current sales rate) surged from 2.7 in December to 4.1 in January but only increased slightly to 4.2 in February. The year-over-year changes are still large with January, 2024 at 3.2 months and February, 2024 at 2.9 months.
The median time on market also increased year-over-year from 22 to 26 but plunged from January’s 35 (perhaps the C.A.R. had a typo?). The C.A.R.’s statewide sales-price-to-list-price ratio was essentially flat year-over declining from 100.0% to 99.9%.
Home closing thoughts
A Strong Forecast from the National Association of Realtors
While I expect the bear market to deepen for the home builder stocks among tepid housing activity, the National Association of Realtors could hardly be more confident. Even though the NAR forecasts only a modest decline in mortgage rates, the organization expects robust housing activity this year: “existing-home sales will increase by 6%, new-home sales will improve by 10% and the national median home price will rise by 3% in 2025.”
Needless to say, I will refer back to this forecast in the coming months!
Local Housing Statistics
One small Bay Area market reflects the surge in California existing home sales. The Tri-Cities area of Newark, Fremont, and Union City saw new listings posted earlier than usual for the spring selling season. According to the Tri-City Voice:
“Sellers kicked off 2025 early. As a result, buyers had more choices. There were 42 homes on the market in Fremont during January 2025 compared with 34 a year earlier. In Newark it was 14 compared with six during 2024, and Union City had 19 compared with seven.”
Homes also moved really fast, so perhaps the statewide numbers are not a typo: “The average number of days a single-family detached home was on the market in Fremont was nine during January 2025 compared to 13 days during January 2024. In Newark, it was 11 days compared to 33 days during last January. In Union City, it was also 11 days which was a decrease from 19 days during January 2024.”
California looks like it could run against my expectations for a tepid spring selling season nationwide.
Still Waiting?
The U.S. News and World Report recently released its third annual Homebuyer Sentiment Survey. Strikingly, a greater share of home buyers than the past two years are waiting for mortgage rates to drop before buying. In a sign of an increasingly frozen housing market, U.S. News reported the following results:
“Four in five homebuyers (80%) are waiting for mortgage rates to drop before buying a home in 2025. That’s an increase from our 2024 and 2023 surveys, when about two-thirds were holding out for lower rates. Among buyers who are waiting for rates to fall, a quarter (25%) want to see them below 5%.”
Some portion of these people must be expecting a significant drop in mortgage rates given the reported optimism about the housing market this year:
“Most homebuyers (57%) think the housing market will improve this year, while 26% think it will get worse and 18% say it will stay the same. Conservatives are far more likely to be optimistic about the housing market than liberals, at 70% vs. 54%.”
The dichotomy by political beliefs is a reminder of the skew that can be present in consumer sentiment surveys from people basing their answers on emotions over evidence.
Spotlight on Mortgage Rates
The Mortgage Bankers Association (MBA) reported weekly increases in mortgage applications in the first half of March and decreases in the second half of the month, a pattern matching February’s changes. The 23-month streak of strong year-over-year performances in new home mortgage purchase applications came to an end in January with a 6% decrease, and continued their decline with another 6.9% decline in February. These declines are now aligned with the slowed sales activity and augur poorly for the spring selling season.
Mortgage rates still seem topped out around 7%. However, after slowly declining through February, mortgage rates bottomed on March 6th and have been creeping slowly higher since then. I expect mortgage rates to remain stuck around current levels for some time as persistent inflationary pressures tug and pull with on-going economic chaos in the U.S.
![Freddie Mac, 30-Year Fixed Rate Mortgage Average in the United States [MORTGAGE30US], retrieved from FRED, Federal Reserve Bank of St. Louis; March 26, 2025](https://drduru.com/onetwentytwo/wp-content/uploads/2025/03/20250326_30-Year-Fixed-Rate-Mortgage-Average-in-the-United-States.png)
Be careful out there!
Full disclosure: long ITB shares

