
Stock Market Commentary
Be ready so that you don’t have to get ready. A perfect storm of fears converged upon the market at today’s open. Recession fears, deleveraging from the end of the carry trade, and perhaps even fresh geopolitical fears from the Middle East, spun the market even further off the road. Retail brokerage sites even groaned under the pressure as retail investors suddenly woke up to risk (and hopefully opportunity) in the stock market. Amid the chaos and selling, the 200-day moving average (DMA) emerged as a major technical signpost. This long-term trend line can serve as a critical dividing line between a correction and a sustained sell-off.
The NASDAQ and IWM barely survived test of 200DMA support while the S&P 500 avoided a 200DMA test. Still, even though the VIX soared to historic levels, market breadth avoided dropping into oversold trading conditions. So now I am uncomfortably monitoring the strength of 200DMA support and the proximity of oversold conditions.
The Stock Market Indices
In my last Market Breadth, I claimed the S&P 500 looks like it is breaking down. Today’s gap down and 3.0% loss confirmed a 50DMA breakdown (the 50DMA is not shown below). Note how a declining 20DMA (the dashed line below) held as perfect resistance. Support from the 200DMA (the blue line below) is now rapidly approaching price and practically insisting on a meeting. This meeting is nearly sure to happen in coming days or weeks just from the 200DMA rising to meet price. Still, I mechanically added to holdings of SPY shares even as my “be ready so I don’t have to get ready” SPY October put spread remains in play.
")
The NASDAQ (COMPQ) already tested its 200DMA and remains the worst-performing of the indices. Buyers stepped in just below the 200DMA and even closed the tech-laden index above its former all-time high from November, 2021. The NASDAQ was down as much as a gut-wrenching 6.3% before ending the day with a 3.4% loss. As soon as my broker allowed me to trade, I bought QQQ shares and took profits near the close of trading. Note how perfectly the NASDAQ’s bearish engulfing pattern signaled a top!
")
The iShares Russell 2000 ETF (IWM) continues to disappoint. Fortunately, buyers jumped in exactly at 200DMA support, and IWM avoided the embarrassment of rotating itself into a fresh bear market. The change of of fortunes has been awesome to behold. Still, I added to IWM shares and even refreshed a calendar call spread. Unfortunately, IWM confirmed its blow-off top and is unlikely to breakout again anytime soon. Back to rangebound trading for IWM for now.
")
The Short-Term Trading Call With A Long-Term Trend Line At Critical
- AT50 (MMFI) = 35.5% of stocks are trading above their respective 50-day moving averages
- AT200 (MMTH) = 47.9% of stocks are trading above their respective 200-day moving averages
- Short-term Trading Call: neutral
AT50 (MMFI), the percentage of stocks trading above their respective 50DMAs, plunged all the way to 29.8% before closing at 35.5%. Now I must ask whether my favorite technical indicator dropped close enough to oversold. The important tests of 200DMA support say yes. A VIX that soared to its third highest close in history says yes. The parallel plunge in AT200 (MMTH), the percentage of stocks trading above their respective 200DMAs, to a low for the year says yes. Yet, AT200 is also well above its lows from last October (see below), so there remains plenty of room for individual stocks to keep falling.
I kept the short-term trading call at neutral even though I have zero interest in opening bearish trades here. I only want to fade rallies (the sharper, the better). In fact, at this juncture starting the market’s three most dangerous months of the year, I prefer to stay neutral until AT50 drops into proper oversold conditions (below 20%). In the meantime, I will make very selective buys with a focus on indices and ETFs.
The volatility index (VIX) has only traded higher twice in its calculated history: the Great Financial Crisis and the pandemic. Unsurprisingly, from such lofty heights, the VIX faded sharply. Yet, the fear gauge still closed with a 64.9% gain. The VIX last closed at these levels in October, 2020. The VIX left plenty of room for bears and bulls to take heart. Bears can look forward to a potential test of today’s intraday high given the amount of room between here and there. Bulls can look forward to the unsustainability of this level of fear and a VIX eventually returning to the 15 – 20 range. For the short-term, I voted with the bulls and added to my SVXY calls.
")
The VanEck Semiconductor ETF (SMH) created one of the most important tests of 200DMA support given how semiconductors, like NVIDIA (NVDA), captured the market’s imagination this year. Buyers barely saved SMH from a 200DMA breakdown. A close below today’s intraday low, will put SMH in bearish positioning. Note how buyers also picked up SMH perfectly from the abrupt April lows.
")
Super Micro Computers, Inc (SMCI) is not a semiconductor stock, but its affinity with NVDA makes SMCI an important part of the story for SMH. SMCI actually lost 200DMA support last week and confirmed its 200DMA breakdown today – very ominous signs. Earnings tomorrow will be the most critical test SMCI has faced in a very long time.
")
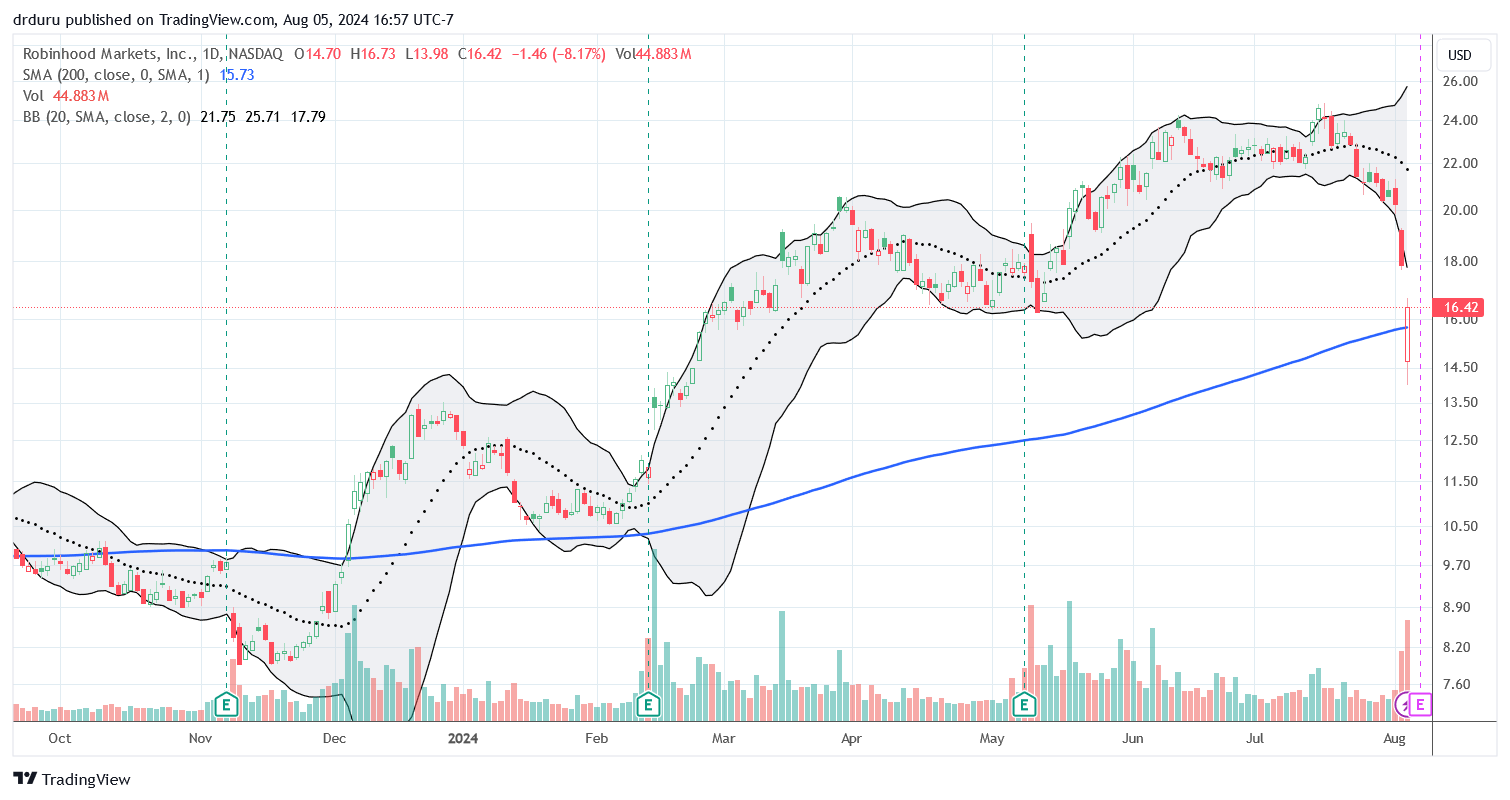
Robinhood Markets, Inc (HOOD) has a critical earnings test coming in 2 days right after it barely survived a 200DMA breakdown. If not for earnings, I would buy HOOD here. Robinhood worked fine straight through the chaos (as far as I know), and the platform should benefit from the increased trading that typically comes with higher volatility. I at least had no issues buying and selling crypto.
DoorDash, Inc (DASH) was one my last set of put options in play. I took profits as soon as I could. DASH found picture-perfect support at its 20DMA and never looked back. DASH even closed at a 3-month high and is back to working on closing its post-earnings gap down from May. Of all the stocks I tracked today, DASH was nowhere on the radar for a potential recovery, much less a gain for the day. I even considered fading it again with fresh put options! Surely this discretionary food delivery business will suffer mightily in a recession, even a feared one…
")
Online learning company Coursera, Inc (COUR) continued its reversal from a monster post-earnings surge. The good news is that the stock looks like it is slowing its descent into a test of 20DMA support. If COUR survives this support, I am a buyer with a little saved for a potential 50DMA test (the red line below).
")
")
")
Be careful out there!
Footnotes
Subscribe for free to get email notifications of future posts!
“Above the 50” (AT50) uses the percentage of stocks trading above their respective 50-day moving averages (DMAs) to measure breadth in the stock market. Breadth defines the distribution of participation in a rally or sell-off. As a result, AT50 identifies extremes in market sentiment that are likely to reverse. Above the 50 is my alternative name for “MMFI” which is a symbol TradingView.com and other chart vendors use for this breadth indicator. Learn more about AT50 on my Market Breadth Resource Page. AT200, or MMTH, measures the percentage of stocks trading above their respective 200DMAs.
Active AT50 (MMFI) periods: Day #175 over 20%, Day #74 over 30%, Day #1 under 40% (underperiod ending 20 days over 40%), Day #2 under 50%, Day #17 under 60%, Day #13 under 70%
Source for charts unless otherwise noted: TradingView.com
Full disclosure: long SPY put spread, long QQQ call, long IWM shares, call spread, and calls; long SVXY calls, long SMH
FOLLOW Dr. Duru’s commentary on financial markets via StockTwits, Twitter, and even Instagram!
*Charting notes: Stock prices are not adjusted for dividends. Candlestick charts use hollow bodies: open candles indicate a close higher than the open, filled candles indicate an open higher than the close.