Stock Market Commentary:
The stock market had quite a bullish week especially considering another Federal Reserve meeting is right around the corner. The week started with a push into overbought conditions and buyers proceeded to slowly steepen overbought conditions the rest of the week. I am quite surprised by this bullish anticipation ahead of the Fed, so I am wary of a major post-Fed disappointment. Still, all is well until it isn’t. For example, Q4 GDP came in stronger than “expectations” on Wednesday, and the market did not tank on fears of a hawkish response from the Fed hawkishness. Perhaps the trading bots agreed with the negative takedown on the GDP components from CNBC’s Kelly Evans.
My earnings highlight of the week came from American Express (AXP). CEO Stephen Squeri outright said he sees no recessionary signals in a Yahoo Finance interview. This was a much stronger claim than management’s observations in its earnings call. For example, CFO Jeff Campbell implied some kind of recession is possible this year: “our 2023 guidance factors in the blue-chip macroeconomic consensus, which is for slowing growth though not a significant recession.” AXP’s guidance certainly does not reflect recessionary signals; the 15-17% expected revenue growth is in-line with the plan the company presented last year. Moreover, the company apparently has no intention to join the layoff parade. From the transcript of the earnings conference call:
“…after every recession there is a recovery. And the last thing you want to do is retrench in such a way that you are not going to be able to take advantage of the recovery. And that retrenchment, looks – it looks like layoffs that don’t make sense and pulling back on marketing and trying to hit an EPS number for a quarter or for a year that is irrelevant. What’s relevant is for a 172-year-old company to continue to grow over the medium and long-term. And the way you do that is you invest judiciously and you invest smartly. And in times when things are bad, you invest in your infrastructure, you invest in your people because you are going to need great people through when a recession is over, and your infrastructure is going to need to do that.”
AXP gained 10.5% in response to all this bullish talk. Maybe, just maybe, the market is slowly pivoting away from pining after a recession as a tool for achieving market-friendly interest rates.
The Stock Market Indices
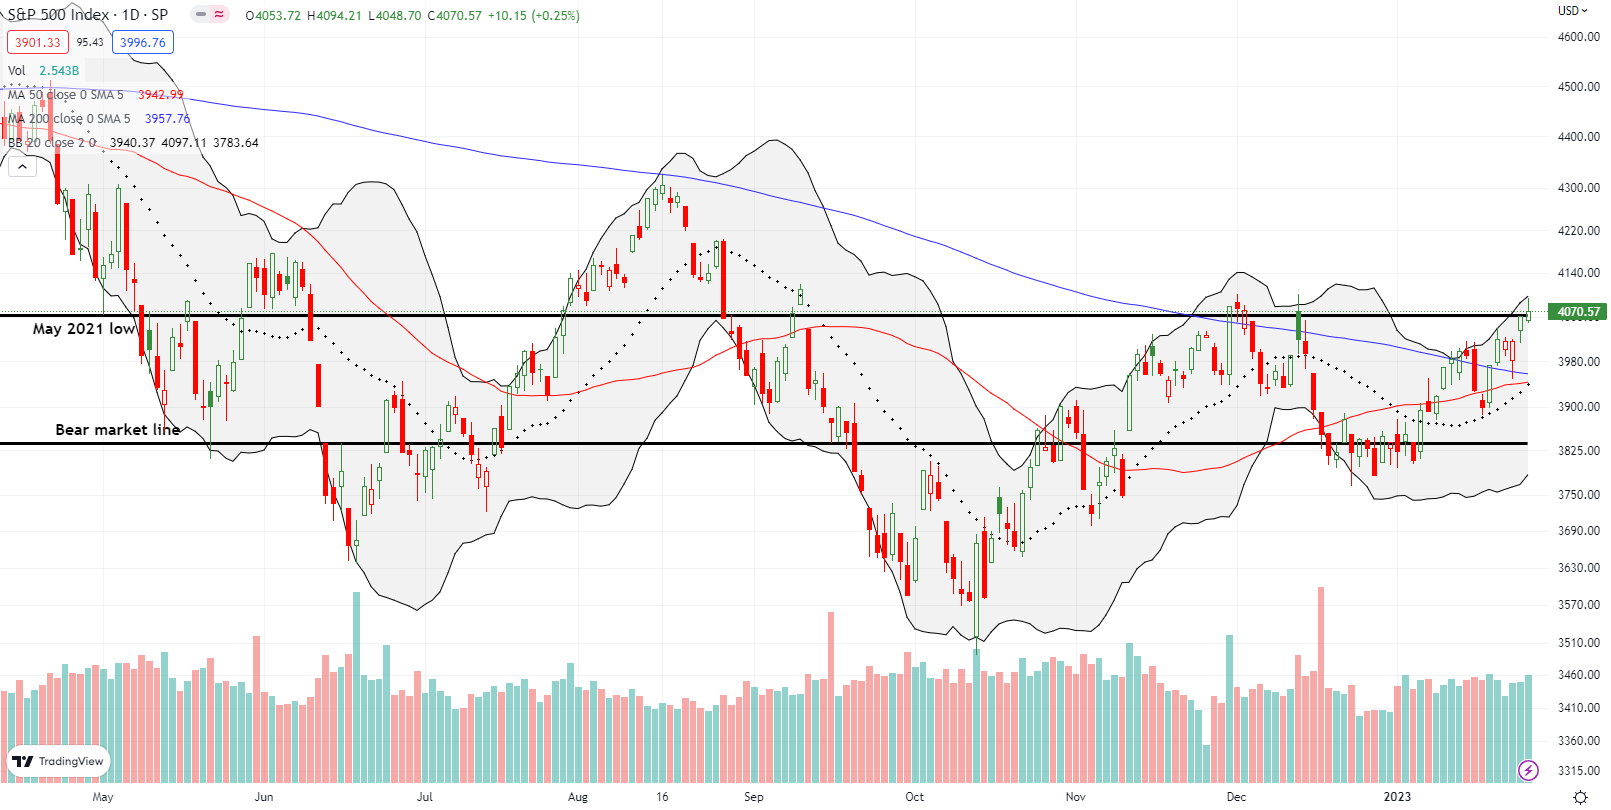
The S&P 500 (SPY) is trying to build some credibility with 5 straight closes above its 200-day moving average (DMA) (the blue line below). The week also ended with a marginal close above the May, 2021 low. Friday’s intraday fade from the highs paid homage to resistance from the September and November closing highs. I used the move to steepen overbought conditions to take profits on both of my SPY call spreads.
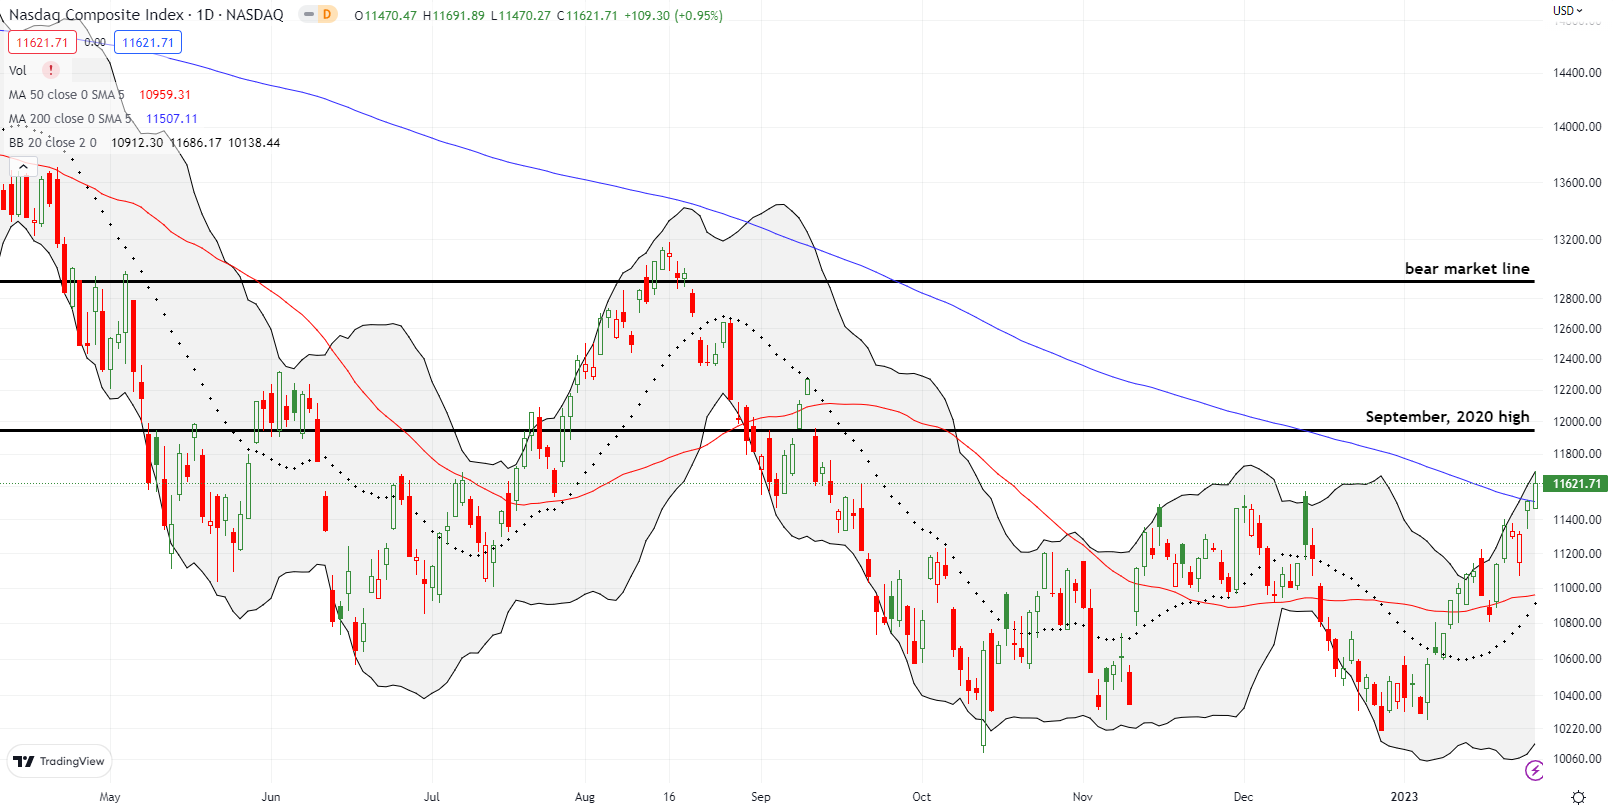
The NASDAQ joined the S&P 500 in reaching a long overdue milestone. For the first time in a little over a year, the NASDAQ (COMPQ) closed above its 200DMA. Friday’s 0.95% gain positioned the tech-laden index to steepen overbought conditions with an overdue challenge of the September, 2020 high. The rebound off the December lows has been impressive…a 13.8% gain and counting.
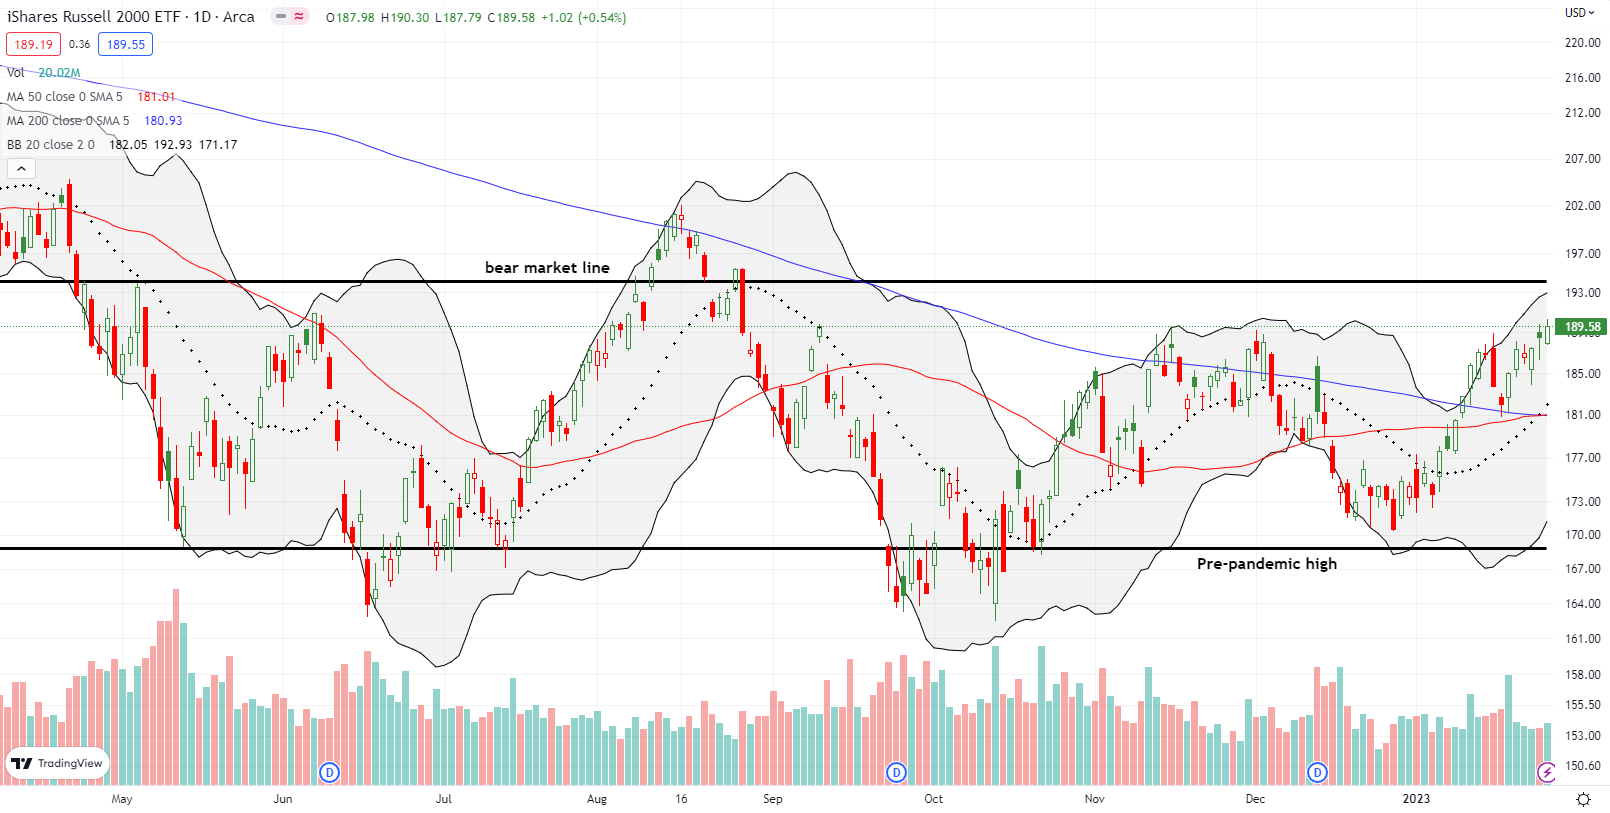
Like the NASDAQ, the iShares Russell 2000 ETF (IWM) closed the week at a 4-month high. The marginal breakout brought the ETF of small caps in direct alignment with its September peak. A move to steepen this ascent will bring a retest of the bear market line.
Stock Market Volatility
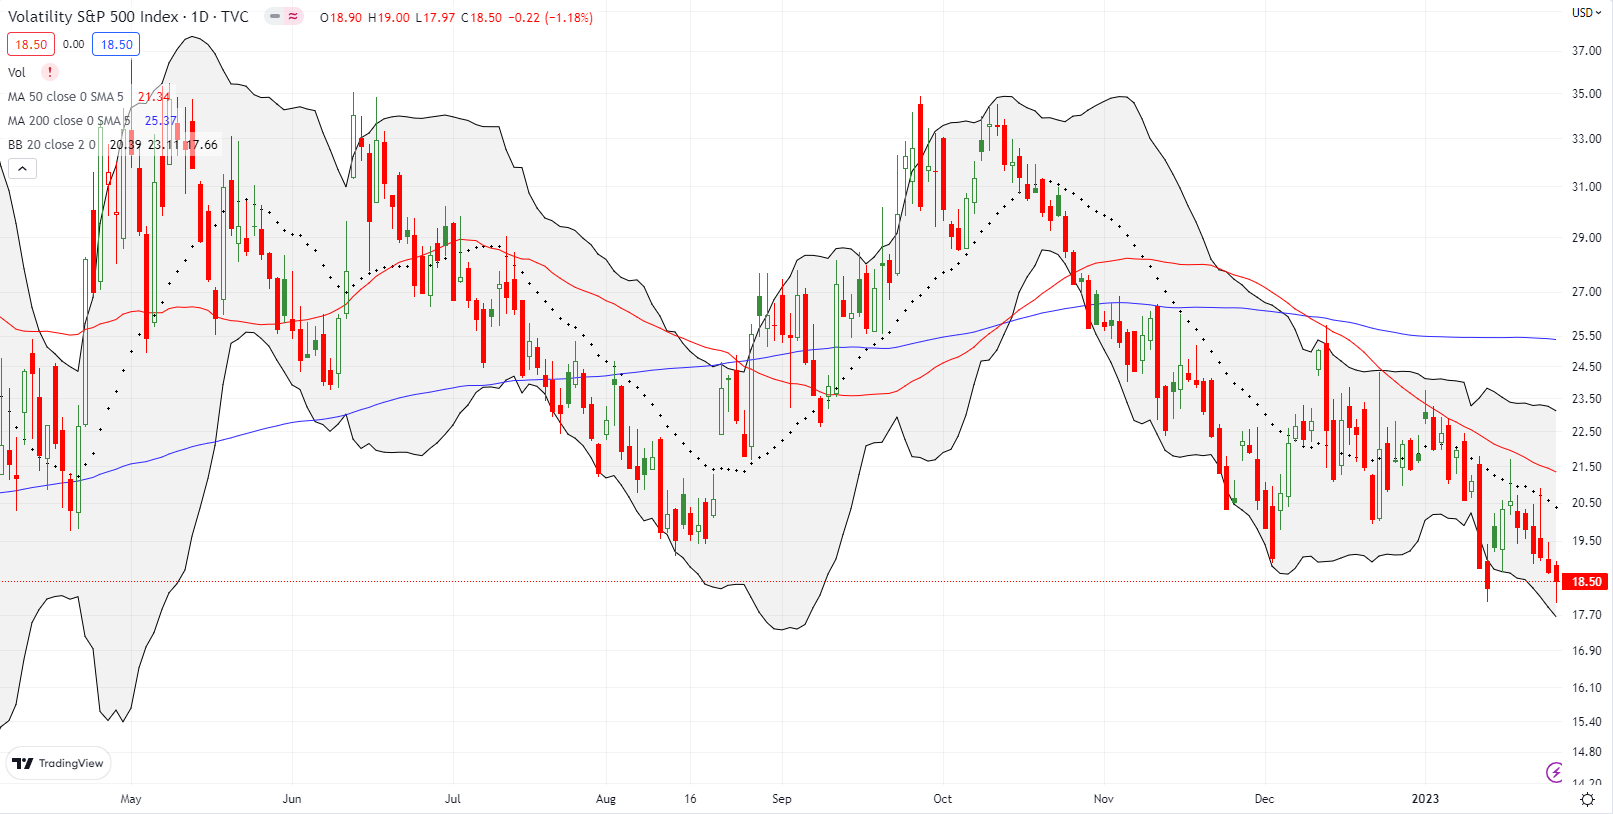
The volatility index (VIX) did not quite cooperate with the market’s bullish anticipation. The VIX “reluctantly” declined each day of the week. Friday’s intraday fade from the highs allowed the VIX to avoid a new 52-week low. Such a milestone would have underlined the market’s bullish anticipation. Instead, the VIX provided bears a lingering hope that the market is overly complacent ahead of the Fed’s coming meeting. If the VIX holds this low going into the Fed meeting, I will look to get long volatility (buy puts on stocks and/or ETFs).
The Short-Term Trading Call As Overbought Conditions Steepen
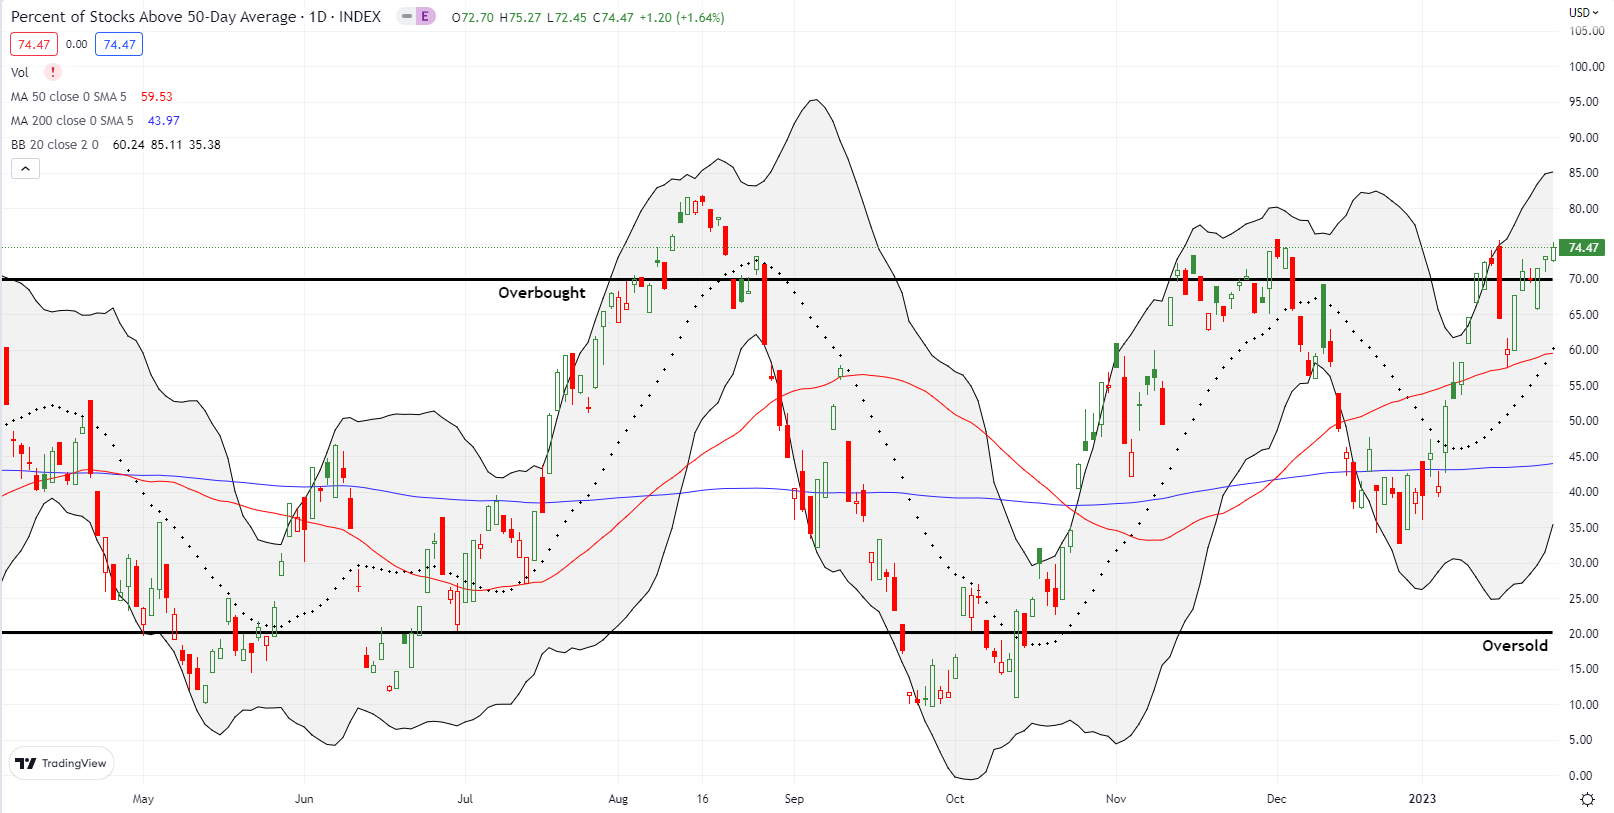
- AT50 (MMFI) = 74.5% of stocks are trading above their respective 50-day moving averages (overbought day #5 and 5-month high)
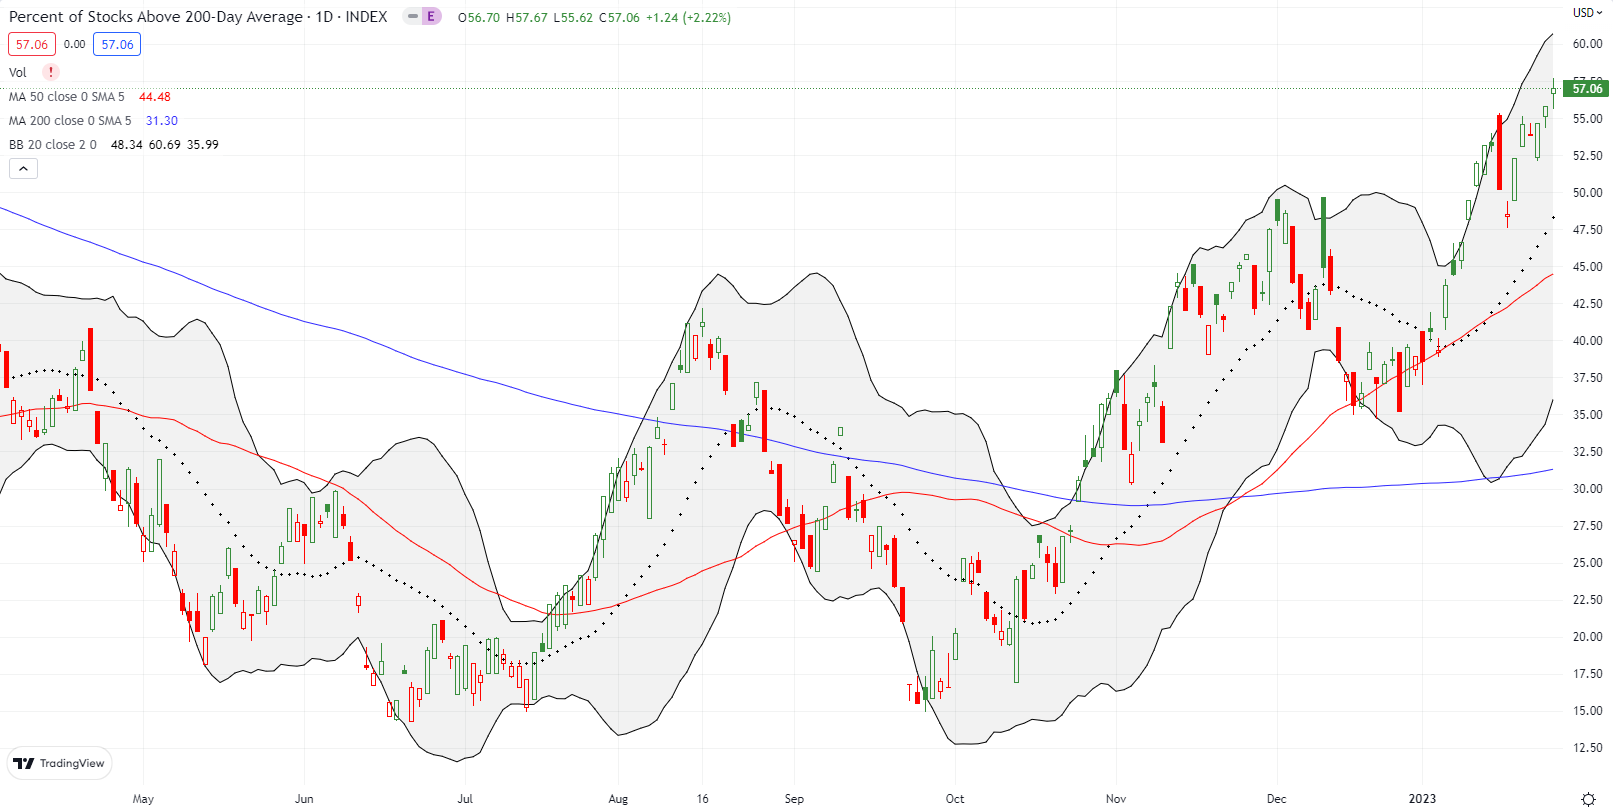
- AT200 (MMTH) = 57.1% of stocks are trading above their respective 200-day moving averages
- Short-term Trading Call: neutral
AT50 (MMFI), the percentage of stocks trading above their respective 50DMAs, stayed in overbought territory all week. I am surprised my favorite technical indicator did not close the week much higher given all the bullish anticipation. Still, as overbought conditions steepen, however small the increments, the market gets closer and closer to bullish extended overbought conditions. The last such run was in late 2020.
Even more telling at this juncture is the action in AT200 (MMTH), the percentage of stocks trading above their respective 200DMAs. This indicator of longer-term sentiment is back in breakout mode. The successful test of the breakout point around 49% increases the odds of an extended overbought cycle….Fed drama notwithstanding of course.
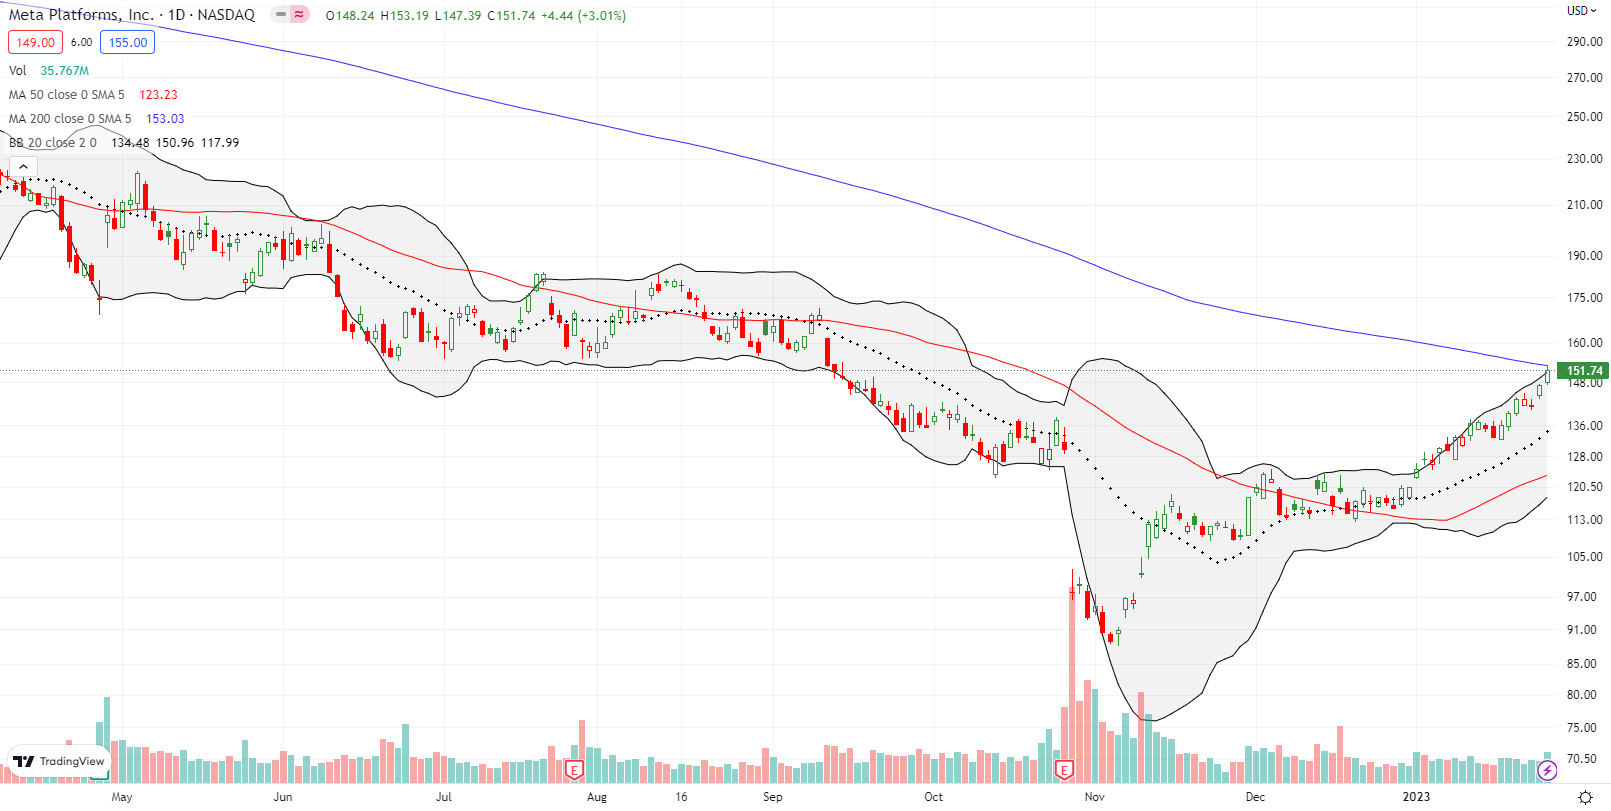
Meta Platforms, Inc (META) has slowly transformed from a huge disaster to an impressive recovery. Earlier this month, META finished reversing its massive October post-earnings loss. Now META faces a huge test at 200DMA resistance just ahead of earnings on February 1st. META also happened to close right at the lows from the summer that held as support until September. META Is a must-watch stock in the coming week. I am not sure I am a buyer on a 200DMA breakout, but I am almost certainly a seller on a 200DMA breakdown.
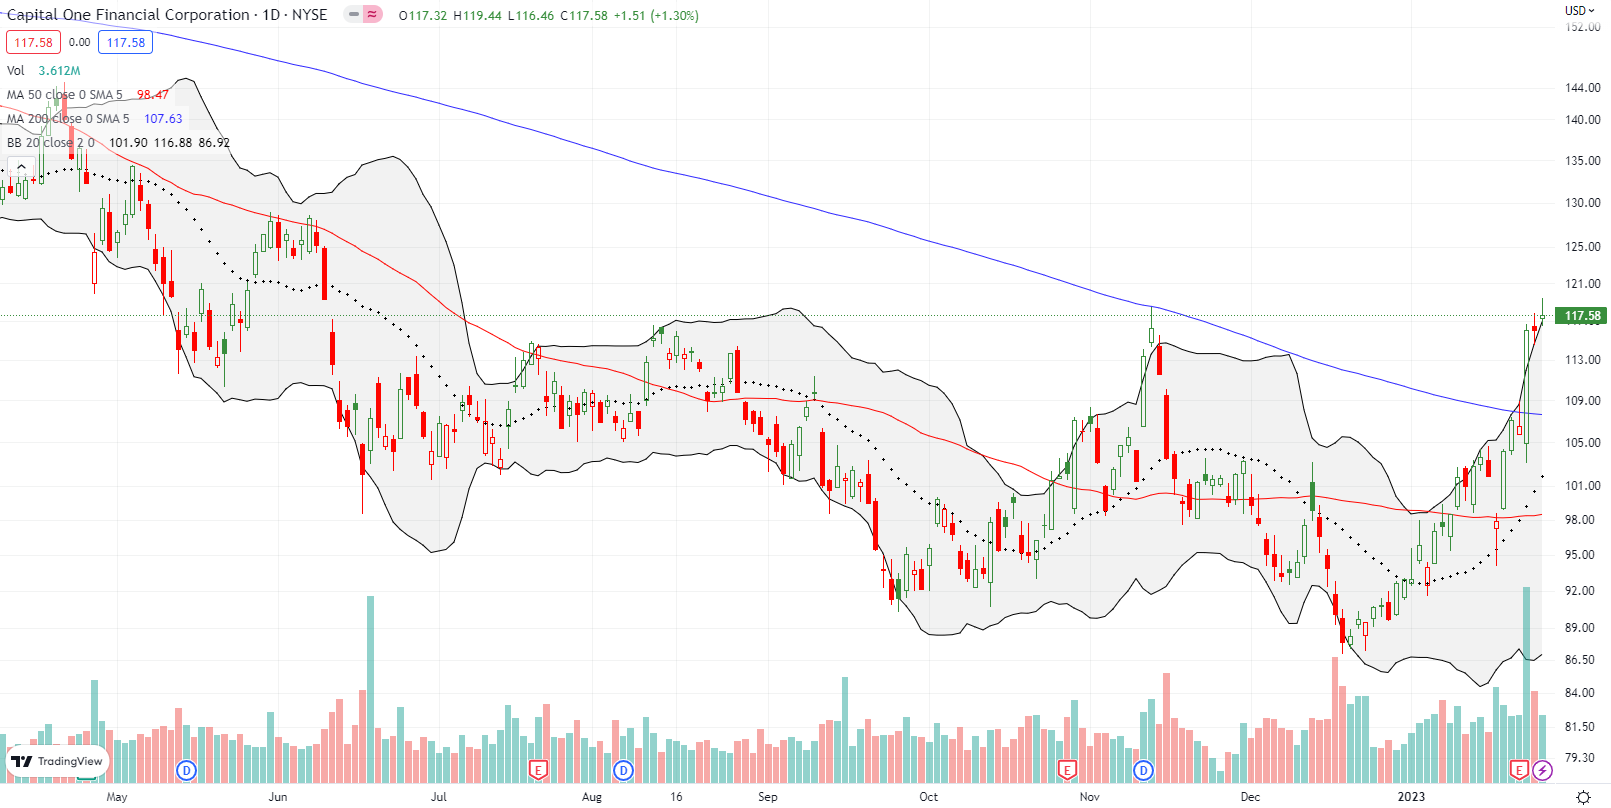
Capital One Financial (COF) surged 9.0% post-earnings and closed above its 200DMA for the first time in 11 months. Buyers followed through on Friday with a confirmation of the 200DMA breakout and a 7-month high. COF delivered another strong message from the financials.
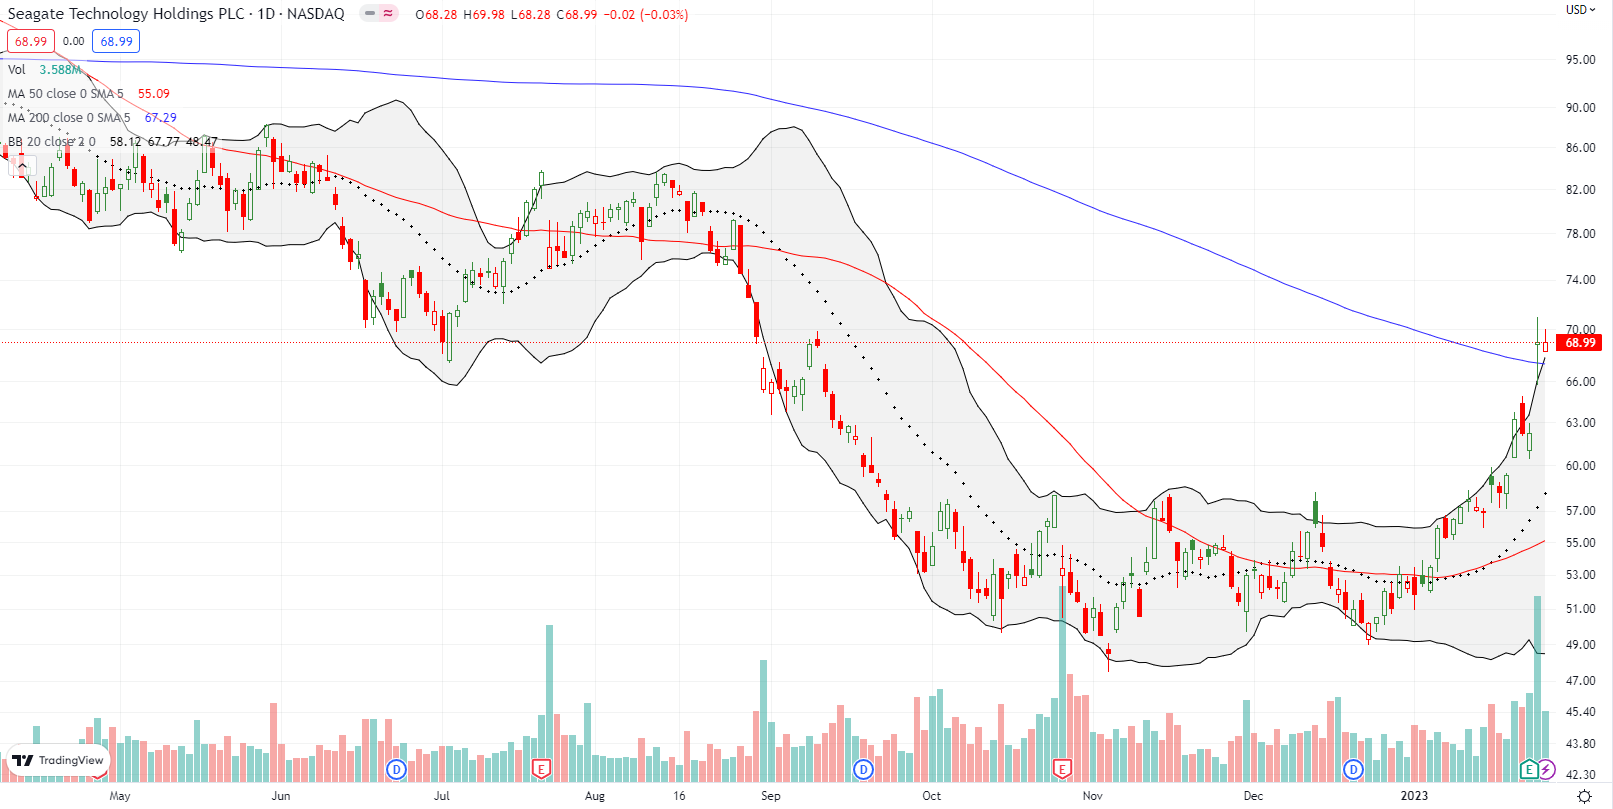
I had my eye on data storage company Seagate Technology Holdings, PLC (STX) as a dividend play (now 4.2%). I am focusing more and more on dividend payers in anticipation of a slower economy. The 10.9% post-earnings gain and 200DMA breakout are bullish. However, I will not chase a tech stock in this environment, especially one that has gone parabolic like STX. I consider STX a buy down to the prior breakout point around $58.
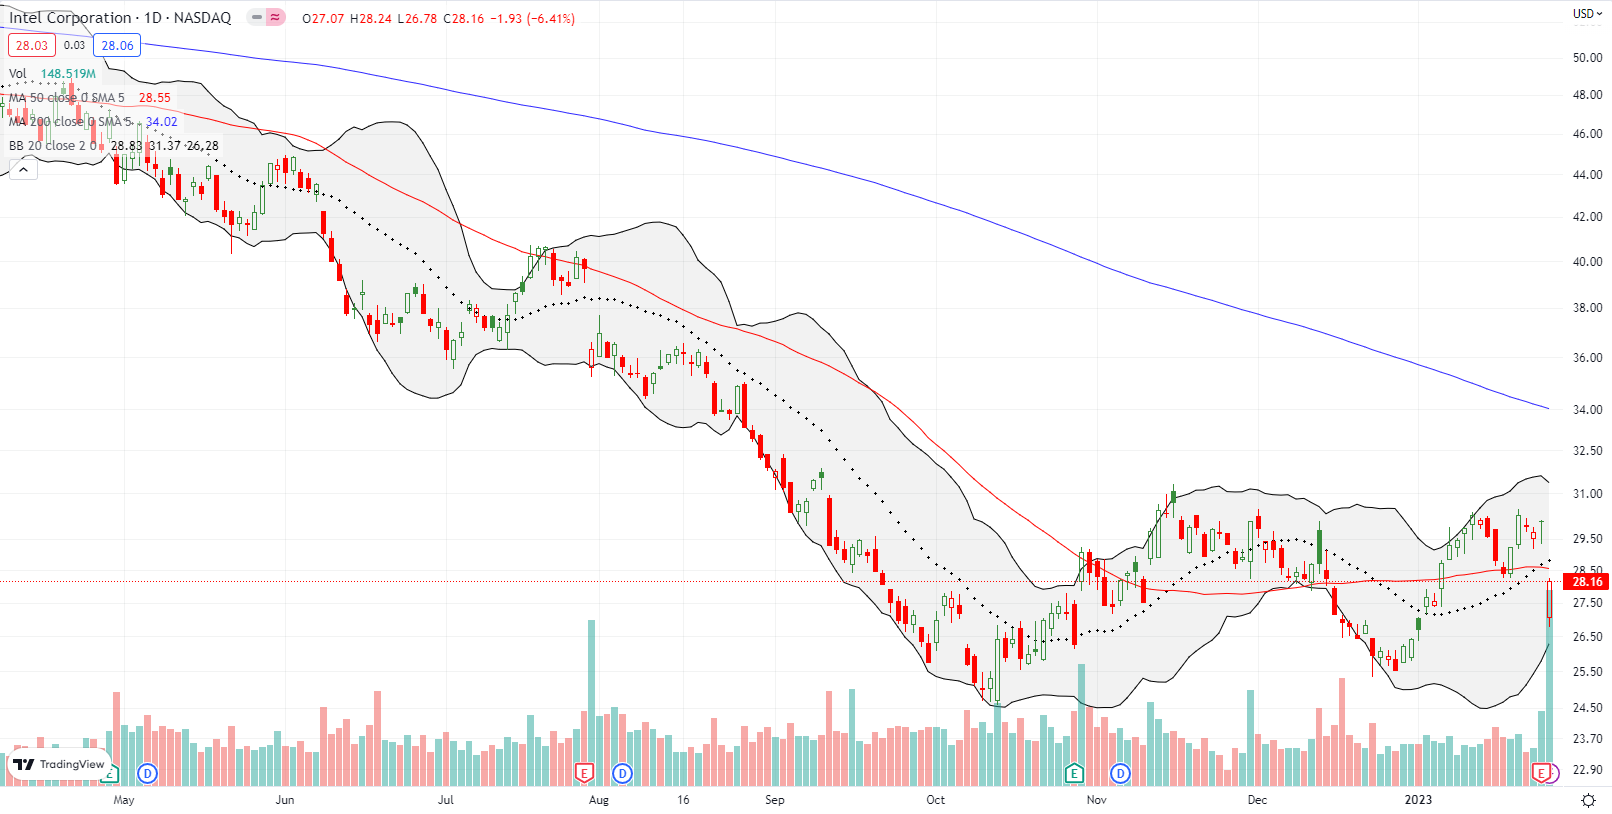
Intel Corporation (INTC) continues to struggle. INTC was down as much as 11.0% before closing at 6.4%. While there is hope given the December low was not breached, INTC looks set for time in purgatory grinding away in a trading range. I had my eye on INTC for its dividend (now 5.2%), but headline results were awful enough to keep me away for now. If INTC can somehow hold its intraday low as support, I might consider a between earnings trade with call options. I already tried a low risk pre-earnings play with a weekly calendar call spread: short Jan 27 $30.5 vs long Feb 2 $30.
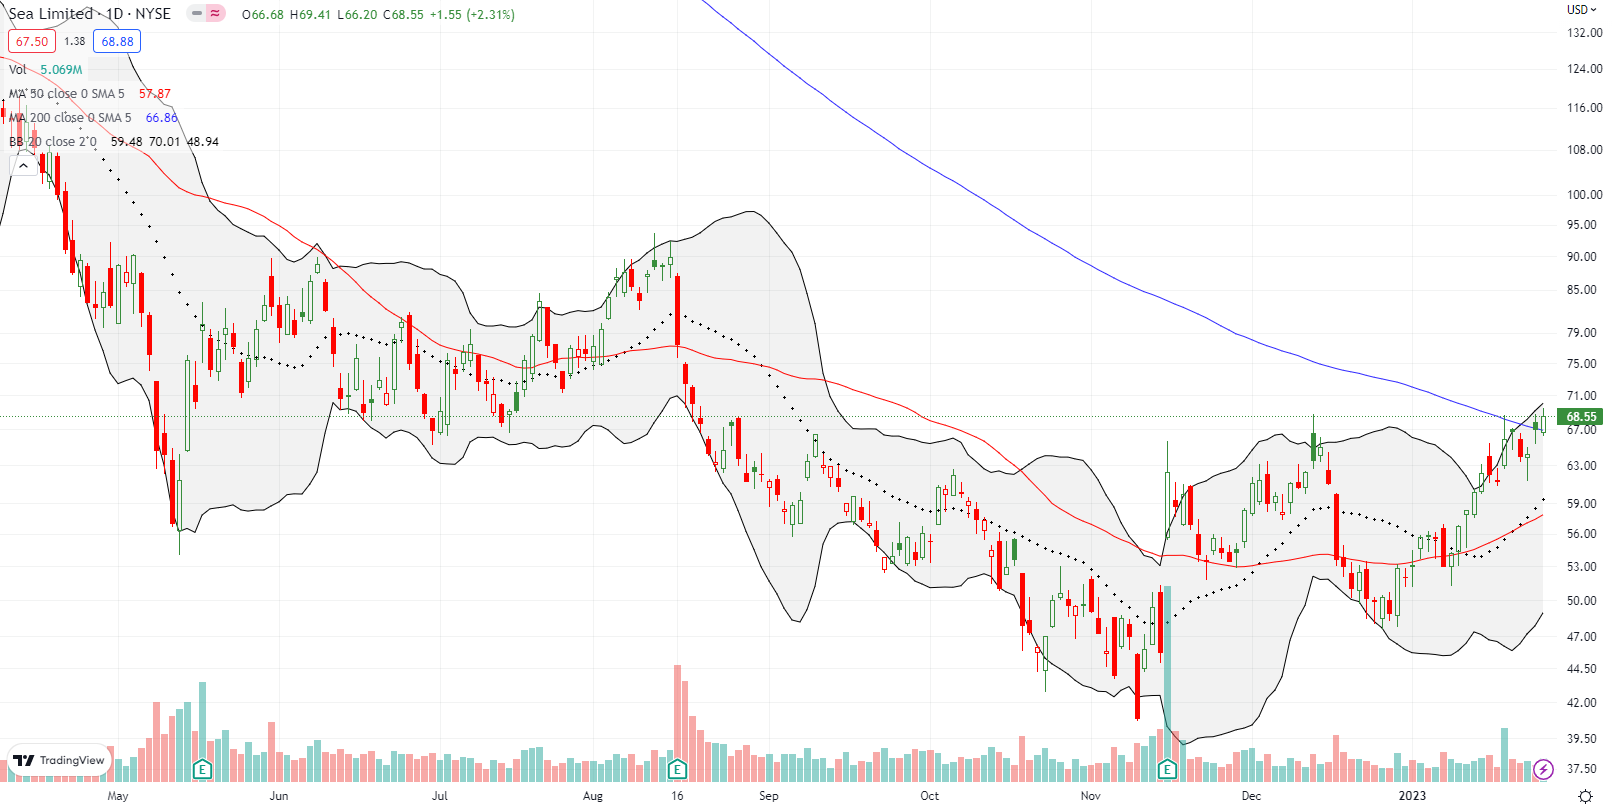
Singaporean-based Sea Limited (SE) was a trading favorite shortly after the pandemic started. The digital entertainment, e-commerce, and digital financial service company seemed well-positioned for the new digital world. accordingly, the pandemic turbocharged the stock to a near ten-fold increase from March, 2020 to November 2021. Now, SE trades 81.3% off its all-time high. Finally, the tides may be changing with a marginally confirmed 200DMA. SE last closed above its 200DMA shortly after the stock hit an all-time high.
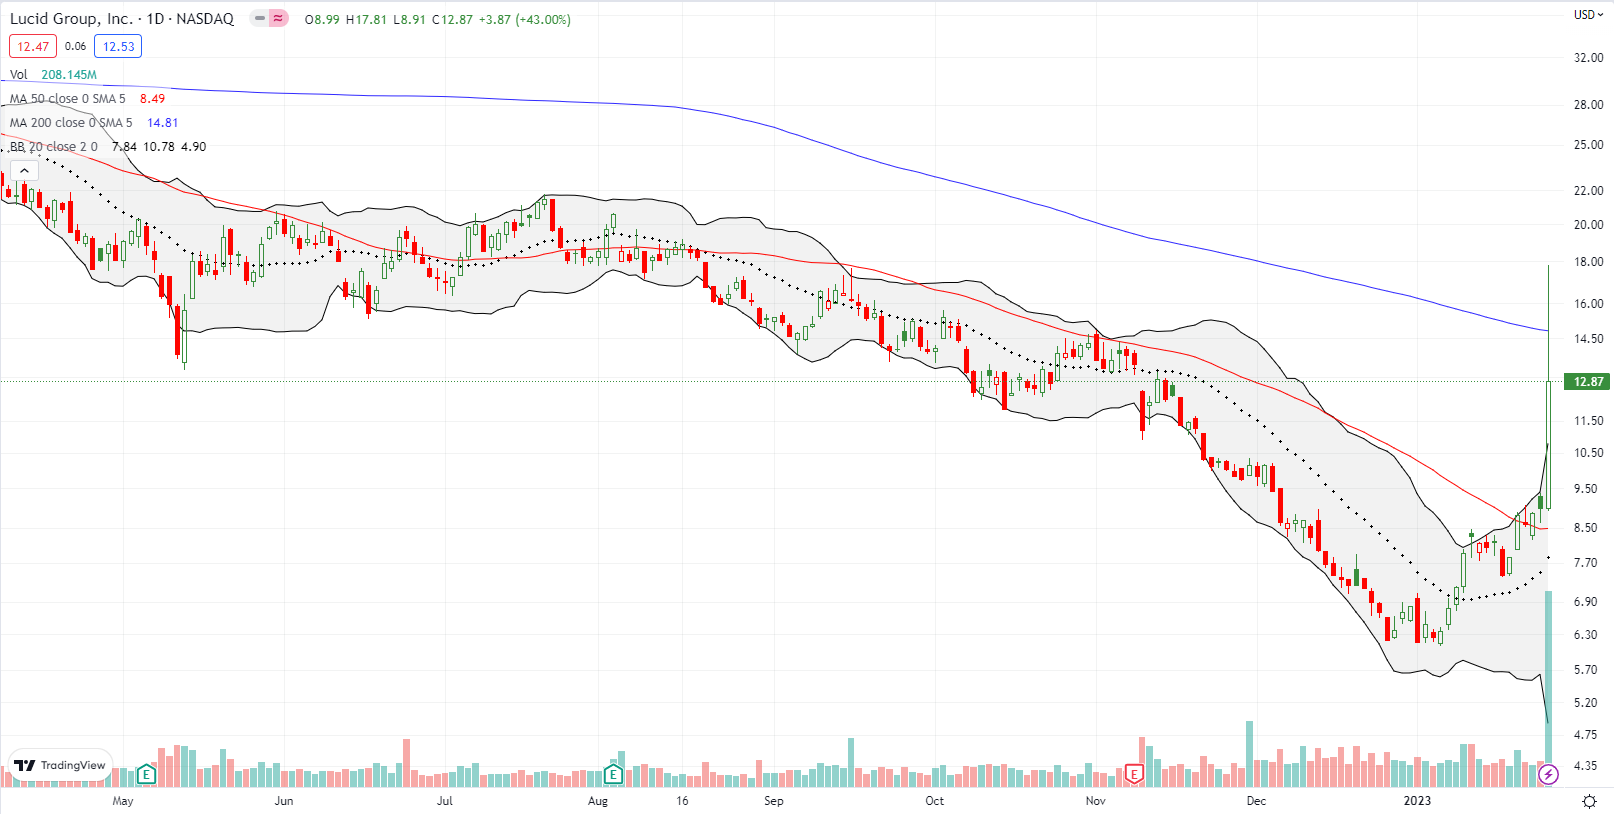
Lucid Group, Inc (LCID) suffered mightily last year. THIS year has so far been a much different story. My favorite EV maker finally made a bottom on the first day of the year. LCID was up 45.9% from that bottom when buyout rumors sent the stock soaring as much as 97.9% on the day. The frenetic trading settled LCID at a 43.0% gain on the day. Even with this surge, LCID is only back to where it traded the day before its last earnings report. I want to be optimistic that a sustainable bottom is in place even if gravity claws back more of Friday’s stratospheric gains.
Be careful out there!
Footnotes
“Above the 50” (AT50) uses the percentage of stocks trading above their respective 50-day moving averages (DMAs) to measure breadth in the stock market. Breadth defines the distribution of participation in a rally or sell-off. As a result, AT50 identifies extremes in market sentiment that are likely to reverse. Above the 50 is my alternative name for “MMFI” which is a symbol TradingView.com and other chart vendors use for this breadth indicator. Learn more about AT50 on my Market Breadth Resource Page. AT200, or MMTH, measures the percentage of stocks trading above their respective 200DMAs.
Active AT50 (MMFI) periods: Day #72 over 20%, Day #68 over 30%, Day #17 over 40%, Day #15 over 50%, Day #12 over 60%, Day #5 over 70% (overbought)
Source for charts unless otherwise noted: TradingView.com
Full disclosure: long QQQ put spread, long LCID
FOLLOW Dr. Duru’s commentary on financial markets via StockTwits, Twitter, and even Instagram!
*Charting notes: Stock prices are not adjusted for dividends. Candlestick charts use hollow bodies: open candles indicate a close higher than the open, filled candles indicate an open higher than the close.


