Stock Market Commentary:
The latest jobs report came on the heels of another post-Fed downer. The U.S. added 261,000 jobs but the unemployment rate ticked up from 3.6% to 3.7%. At the open, the market seemed to celebrate the potential implications for looser monetary policy despite the microscopic change in the unemployment rate. China delivered a tailwind going into the open with President for life Xi Jinping earlier declaring in Shanghai that “we will step up efforts to cultivate a robust domestic market, upgrade trade in goods, develop new mechanisms for trade in services, and import more quality products…China will work with all countries and parties to share the opportunities in its vast market.” The iShares China Large-Cap ETF (FXI), which traded at a near 17-year low last week, surged 7.9% on this news. At some point, “someone” must have noticed that U.S. interest rates were still going higher and decided to start a fade of the open’s gains. Yet, the U.S. dollar remained weak, commodities continued rallying, and the VIX continued its decline. At the end of the day, financial markets managed to net gains from all this confusion.
Fortunately, in this moment, the technicals are not as convoluted as the economic and financial signals (or better yet, the market currently has less confusion when responding to technical factors than fundamental ones). The stock market is still working off the presumption of October’s bottom. Looking ahead, seasonal factors from the end of the year’s most dangerous months for drawdowns to a post midterm election bounce to Black Friday shopping season and to the Santa Claus rally all offer the promise to reward buying the dip on oversold conditions and/or tests of key support. I fully anticipate an on-going pull of “to rally or not to rally” as frenetic trading whips price action up and down.
The Stock Market Indices
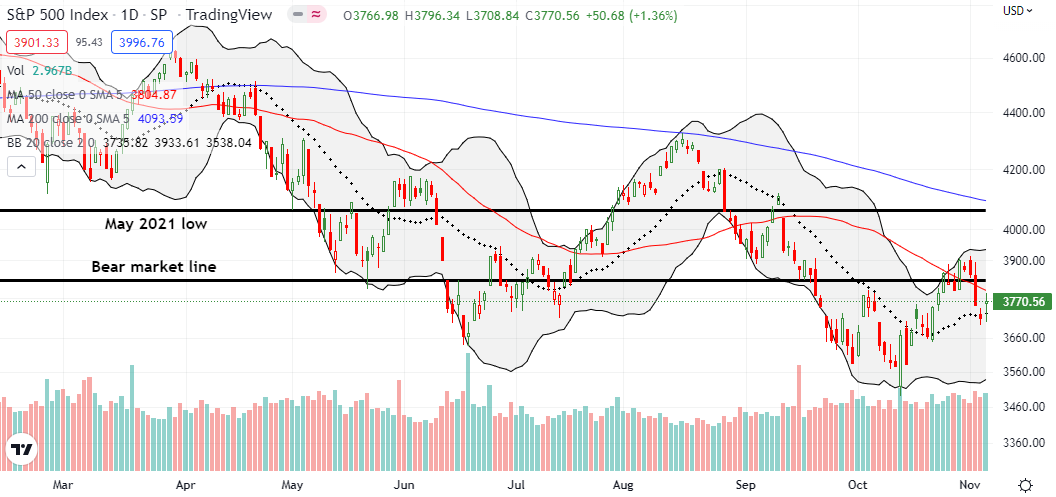
The S&P 500 (SPY) opened higher, faded from resistance at its 50-day moving average (DMA) (the red line below), traded back down to its 20DMA (the dotted line below), and rebounded to where it started the day. It was a day of churn that only trading bots could love. The confluence of market catalysts clearly created differing opinions and interpretations. The resulting confusion created wins for bulls (20DMA support) and bears (50DMA resistance). I am anticipating more frenzy ahead with this proximity of so many technically important levels, including the bear market line.
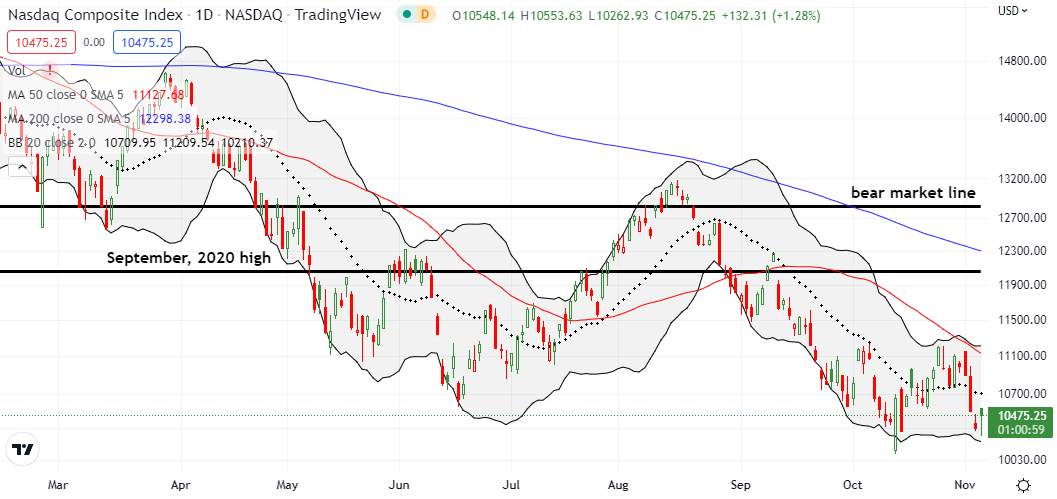
The NASDAQ (COMPQ) came close to a freshly bearish move. At its intraday low, the tech-laden index broke below its closing lows for the year which in turn are at price levels last seen 28 months ago. A short-term bullish spin on the positioning points to a trade back to declining 50DMA resistance. I am inclined to leave the NASDAQ alone here. I am not entering new tech trades until I see a 50DMA breakout. There are better places in the market to play future oversold trading conditions and/or tests of support. On Thursday, I even opened a QQQ $255 calendar put spread for a hedge with the short-side deftly expiring worthless on Friday.
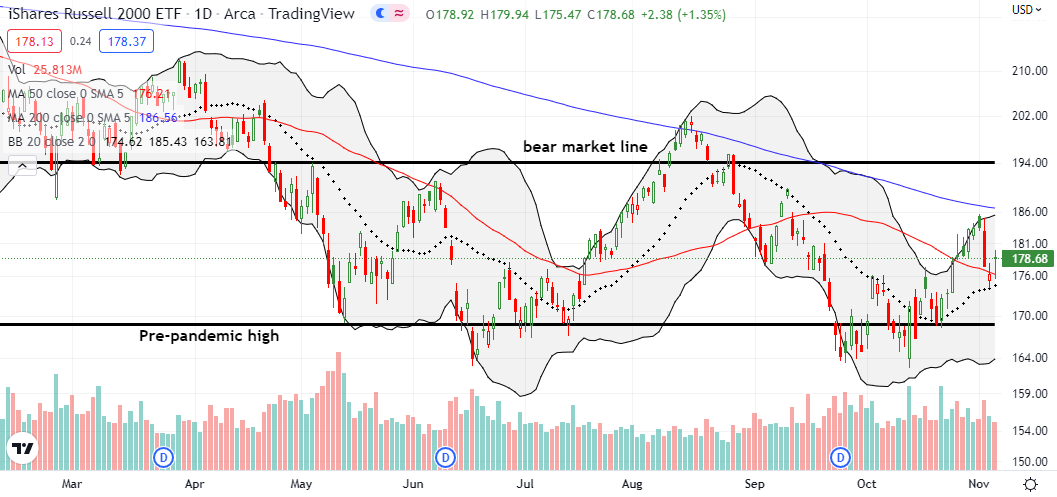
The iShares Russell 2000 ETF (IWM) still looks stronger than the other two major indices. Buyers brought a swift end to IWM’s 50DMA breakdown and delivered a confirmation of 20DMA support. They even defended 50DMA support on an intraday basis. IWM is back in position for a fresh challenge of overhead 200DMA resistance. I jumped into a Nov 18 $180/185 call spread to make that bet.
Stock Market Volatility
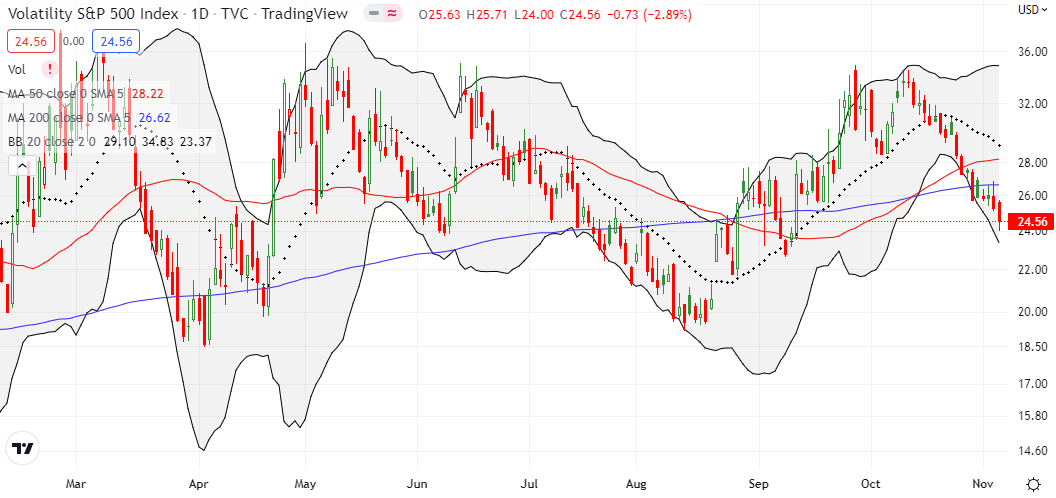
I was surprised by the post-Fed stalemate on the volatility index (VIX). I described it as the one sliver of positivity left for bulls and buyers on the day. The VIX went on to trade decisively lower to close the week. Apparently, per CNBC’s Options Action, traders are actively selling puts and buying calls which I assume is helping to suppress the VIX. Still, until prove otherwise, I interpret this on-going VIX decline as supportive of a bullish bias on the market in general (especially beyond tech).
The Short-Term Trading Call With Confusion
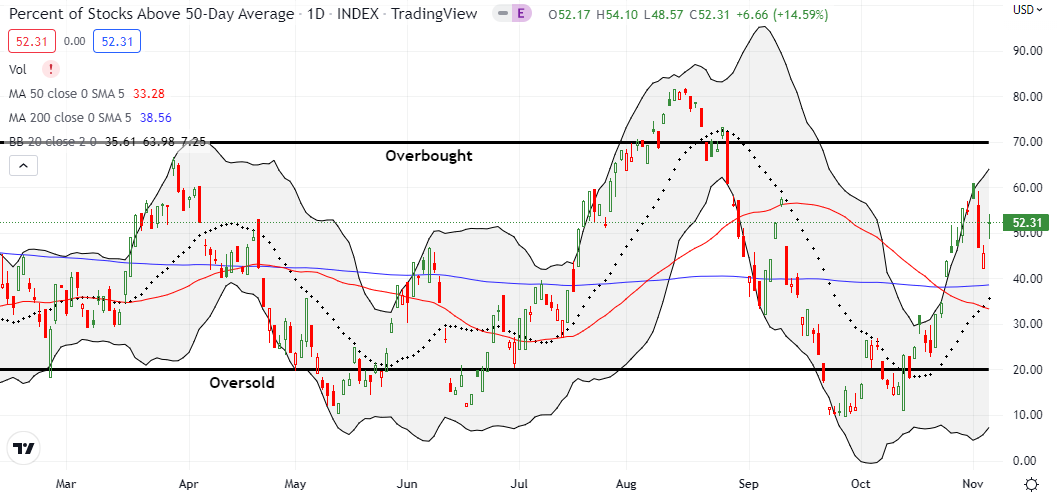
- AT50 (MMFI) = 52.3% of stocks are trading above their respective 50-day moving averages
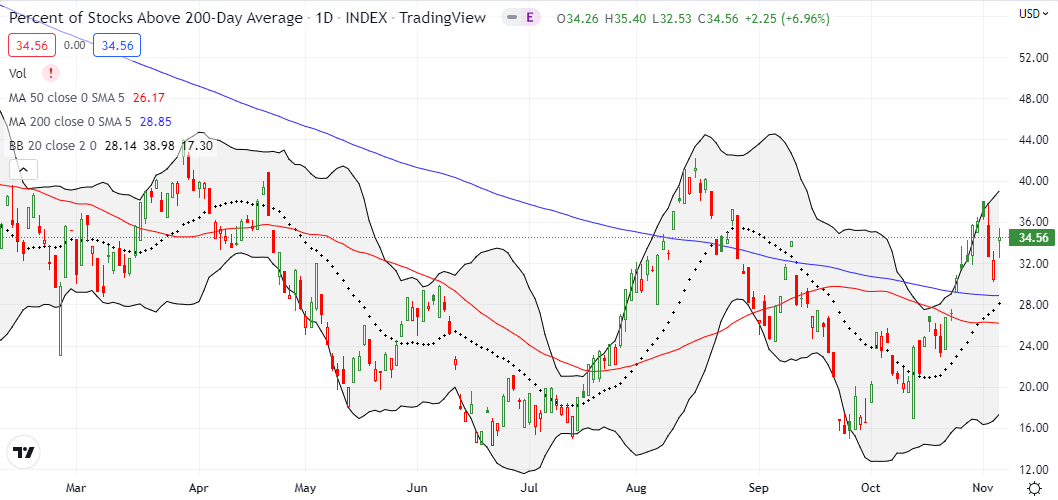
- AT200 (MMTH) = 34.6% of stocks are trading above their respective 200-day moving averages
- Short-term Trading Call: cautiously bullish
AT50 (MMFI), the percentage of stocks trading above their respective 50DMAs, pulled out of the confusion with a gain of 7 percentage points. This rebound made the week’s earlier top look a little less ominous. My favorite technical indicator still has a small shot to rally higher into a challenge of overbought trading territory (above 70%). Accordingly, the short-term trading call remains cautiously bullish.
Venture capitalist Howard Lindzon posted a timely missive in his daily email that he included in a tweet. It seems Elon Musk’s bid for Twitter (TWTR) received a boost from passing the hat among a range of private market investors including Cathie Wood’s new ARK Venture Fund (Wood is of course one of Elon Musk’s biggest fans and unconditional supporters). This year, Wood and team frequently waxed poetic about the higher premiums received by private market companies as premiums for ARK “innovation” companies imploded this year. So, it makes sense that ARK would chase the private market with an offering like the ARK Venture Fund. Yet, as Howard notes below, this kind of extended speculation suggests that the Fed still has plenty of room to keep tightening monetary policy.
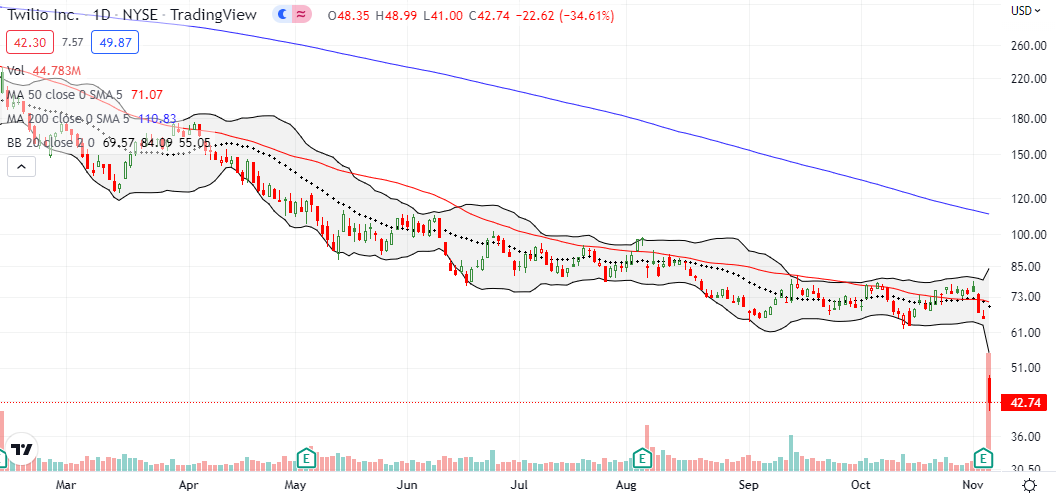
Speaking of imploding premiums for ARK innovation companies, Twilio Inc. (TWLO) became the latest post-earnings disaster in tech and the cloud software space in particular. Based on allocation, three of the top four ETFs invested in TWLO are ARK funds (ARKF, ARKW, and ARKK). TWLO crashed 34.6% post-earnings, is down 83.8% this year, and down 90.4% from its all-time high in February, 2021. TWLO now trades at a 4 1/2 year low. Ironically, Cathie Wood this week chose to celebrate big cap tech finally joining ARK Funds as the bottom falls out in the space; she titled the video “De-FAANG’d.”
Be careful out there!
Footnotes
“Above the 50” (AT50) uses the percentage of stocks trading above their respective 50-day moving averages (DMAs) to measure breadth in the stock market. Breadth defines the distribution of participation in a rally or sell-off. As a result, AT50 identifies extremes in market sentiment that are likely to reverse. Above the 50 is my alternative name for “MMFI” which is a symbol TradingView.com and other chart vendors use for this breadth indicator. Learn more about AT50 on my Market Breadth Resource Page. AT200, or MMTH, measures the percentage of stocks trading above their respective 200DMAs.
Active AT50 (MMFI) periods: Day #15 over 20%, Day #11 over 30%, Day #9 over 40%, Day #1 over 50% (overperiod), Day #49 under 60% (underperiod), Day #50 under 70%
Source for charts unless otherwise noted: TradingView.com
Full disclosure: long IWM calendar call spreads, long SPY calendar call spread, long QQQ put, long ARKK shares and puts, long ARKF
FOLLOW Dr. Duru’s commentary on financial markets via StockTwits, Twitter, and even Instagram!
*Charting notes: Stock prices are not adjusted for dividends. Candlestick charts use hollow bodies: open candles indicate a close higher than the open, filled candles indicate an open higher than the close.


