Stock Market Commentary:
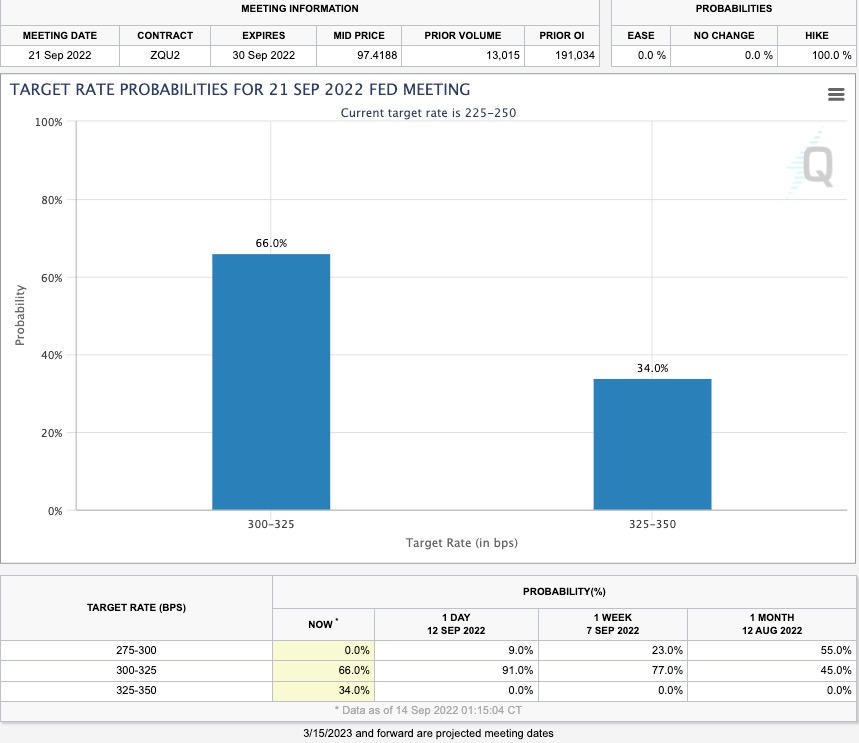
Pricing pressures are apparently NOT easing just yet. The August CPI report turned “peak Fed” into “fear the Fed” all over again. Instead of falling, core inflation (CPI excluding food and energy) increased a whopping 0.6% month-over-month. This surge pushed the 12-month core inflation rate up from July’s 5.9% to August’s 6.3%. Fed fund futures shifted from a zero chance of a 1 percentage point rate hike this month to a 34.0% chance. Moreover, the market shifted the Fed’s peak rate in 2023 to 4.5%. This stunning turnaround was so violent that it unplugged the rally and synchronized breakout that preceded the CPI news. Last week’s synchronized breakouts turned into this week’s synchronized breakdowns – a monster fakeout made all the more disappointing given how the market just rebounded from ominous failures at resistance.
The sharp reaction also spilled out in the currency market. The U.S. dollar surged mightily against all major currencies. The shocker in the currency markets fed right back into the shocker in equity markets.
The Stock Market Indices
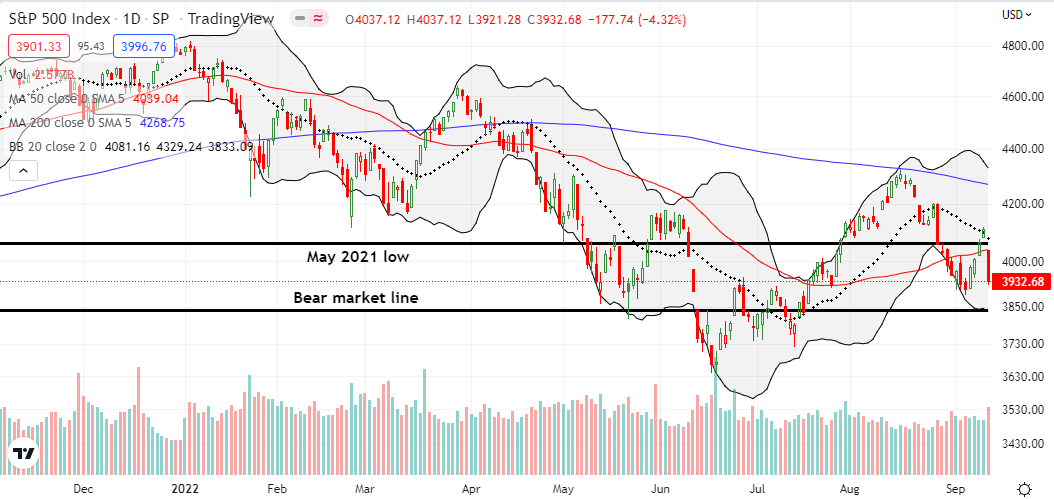
The S&P 500 (SPY) led the way for last week’s synchronized breakout and led the way down. The gap down below the 50-day moving average (DMA) (the red line below) instantly created a fakeout just one day after follow-through buying. With the 20DMA (dotted line) holding as resistance, the S&P 500 flipped from a potential challenge to 200DMA (blue line) resistance to a potential return to bear market territory. This turn-around was so abrupt that my SPY put option transitioned from life support to hitting my profit target for the week. I next bought an SPY calendar call spread in case the market’s choppy action flips the script yet again.
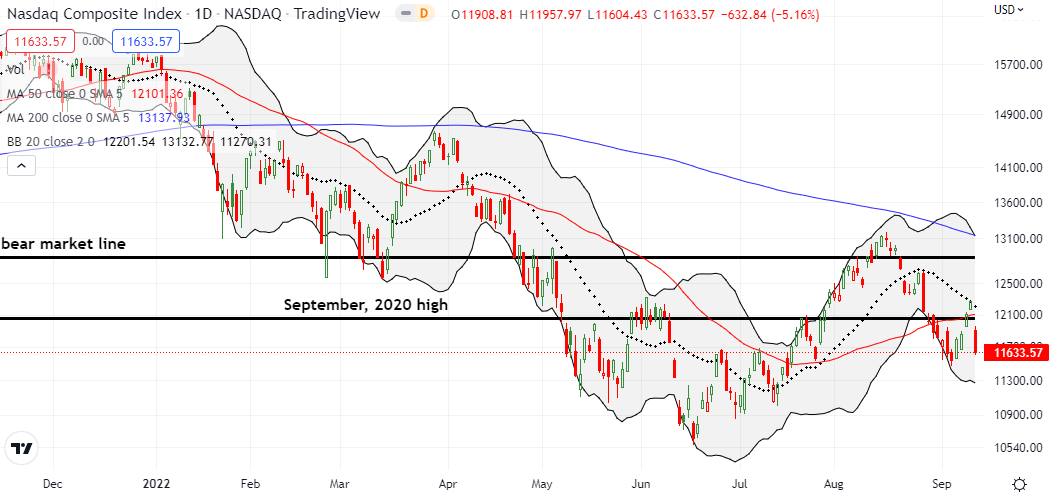
The NASDAQ (COMPQ) may remain stuck in a bear market for the rest of the year at this rate. The tech-laden index suffered a power failure similar to the S&P 500’s trauma. The NASDAQ went from confirming its 50DMA breakout to failing at 20DMA resistance. The subsequent gap down below the 50DMA and the September, 2020 high turned into a massive 5.2% loss on the day. Follow-through selling would quickly put the June lows back in play with only next week’s Fed meeting offering a sliver of hope to stop the slide. I decided to hold on to my QQQ puts for at least one more day.
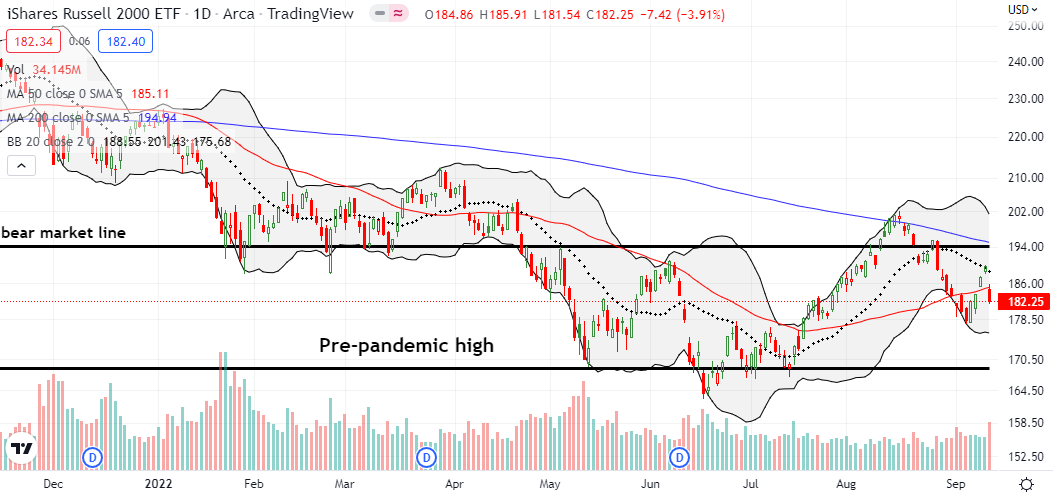
The iShares Russell 2000 ETF (IWM) unplugged the lights on my (formerly) timely call spread. IWM maintained the synchronicity with the other major indices by perfectly failing at 20DMA resistance and gapping below 50DMA support. The ETF of small caps lost 3.9% for the day. IWM has a little more room than the other two major indices for defending the September lows.
Stock Market Volatility
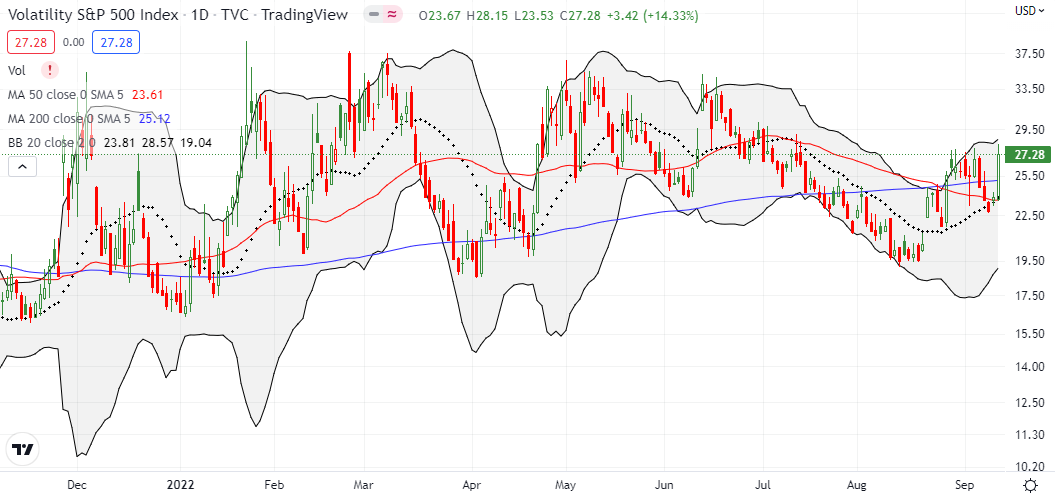
So much for a test of the all-important 20 level being in the cards! The volatility index (VIX) flipped the script with a violent surge right back to recent highs. Suddenly, the reverse test is in play. VIX faders kept the VIX off the recent intraday highs, but can they prevent upward follow-through? If not, bearish sentiment will plug in where the breakout unplugged.
The Short-Term Trading Call After An Unplug
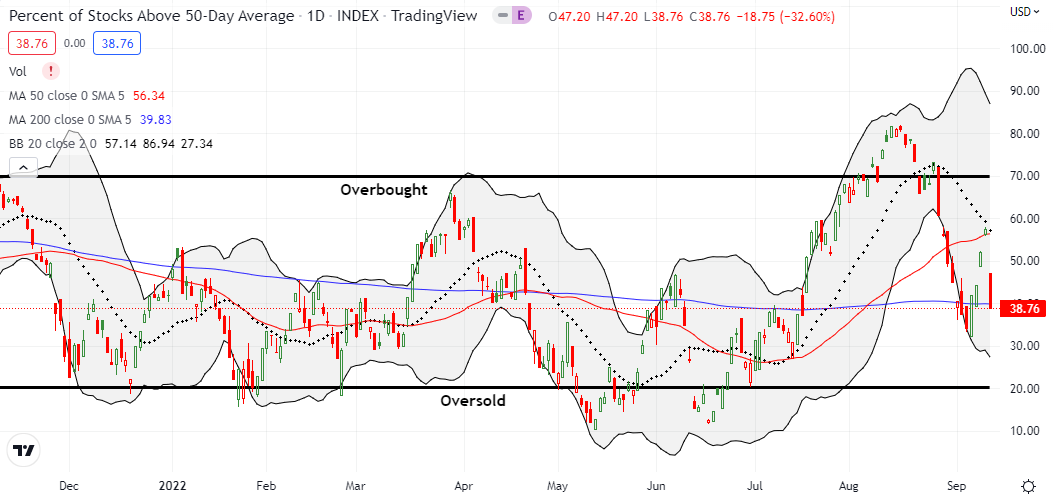
- AT50 (MMFI) = 38.8% of stocks are trading above their respective 50-day moving averages
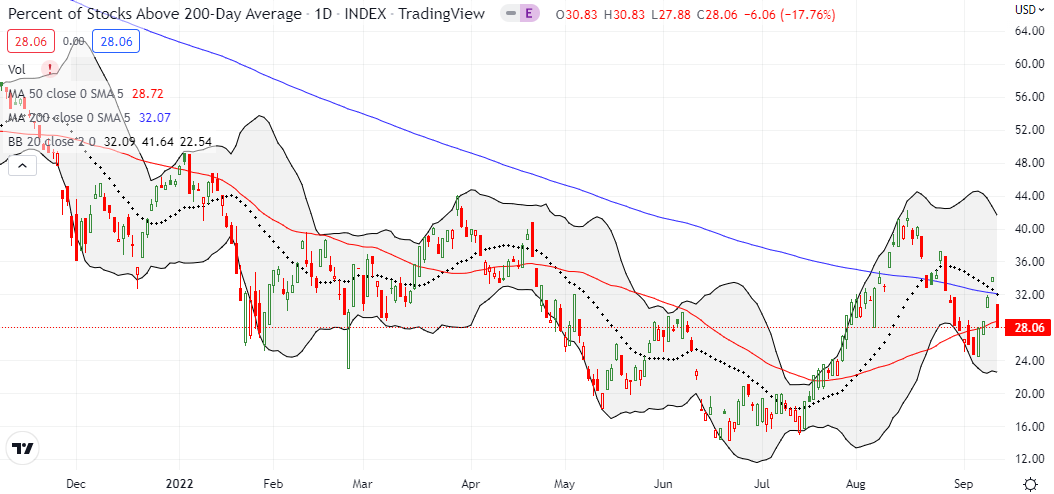
- AT200 (MMTH) = 28.1% of stocks are trading above their respective 200-day moving averages
- Short-term Trading Call: neutral
AT50 (MMFI), the percentage of stocks trading above their respective 50DMAs, collapsed from 57.5% to 38.8%. It was quite a shocking turn-around, especially given Monday’s move convinced me of an imminent, fresh challenge of the overbought threshold at 70%. Instead, AT50 looks ready to make a run for oversold all over again. Churn sits In between these two expectations of extremes. A tighter trading range is perhaps the best we can expect for now.
I kept the trading call at neutral. I am relieved I did not upgrade all the way to bullish based on the now fake breakout. However, because I unloaded most my bearish positions in the last sell-off, I had little protection from this sudden unplug from the breakout. I will unload my few remaining bearish positions this week and then hold my breath from there.
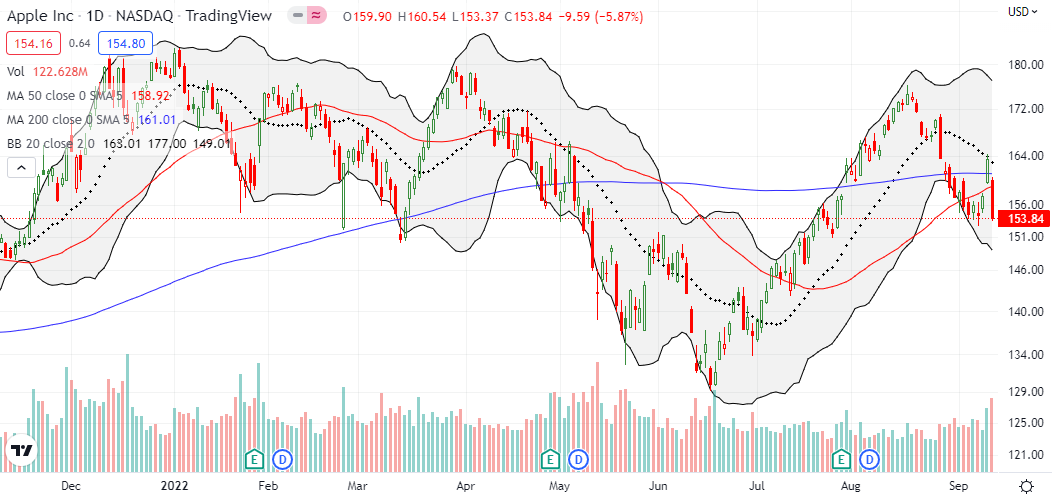
Apple (AAPL) is once again a poster child for the market’s moves. AAPL surged on Monday by 3.9%. The resulting breakout looked like a definitive confirmation of the market’s synchronized 50DMA breakouts. The outsized 5.8% turn-around confirmed the return of bearish trading action. AAPL even closed near a 2-month low and thus has high risk to continue lower in the next few days.
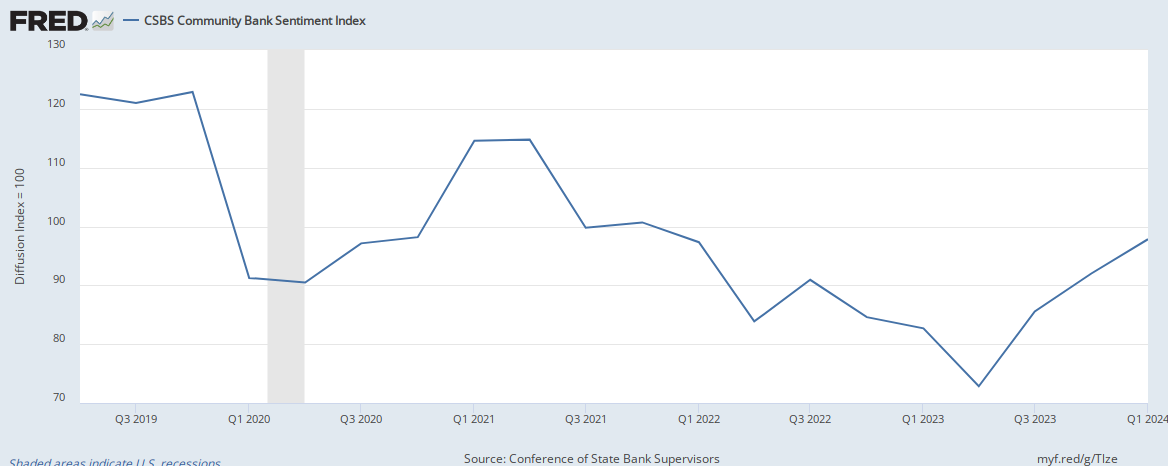
On the fundamental side, the St. Louis Federal Reserve released a new dataset on the sentiment of community bankers. This Community Bank Sentiment Index comes from the Conference of State Bank Supervisors. These financial folks are so dour that sentiment fell to a new pandemic-era low. They must be getting their cues from consumers. Count this chart as another confirmation of the generally bad mood about the economy even as the stock market does its best to fight the Fed.
Be careful out there!
Footnotes
“Above the 50” (AT50) uses the percentage of stocks trading above their respective 50-day moving averages (DMAs) to measure breadth in the stock market. Breadth defines the distribution of participation in a rally or sell-off. As a result, AT50 identifies extremes in market sentiment that are likely to reverse. Above the 50 is my alternative name for “MMFI” which is a symbol TradingView.com and other chart vendors use for this breadth indicator. Learn more about AT50 on my Market Breadth Resource Page. AT200, or MMTH, measures the percentage of stocks trading above their respective 200DMAs.
Active AT50 (MMFI) periods: Day #50 over 20%, Day #44 over 30% (overperiod), Day #1 under 40% (underperiod ending 4 days over 40%), Day #3 under 50%, Day #11 under 60%, Day #12 under 70%
Source for charts unless otherwise noted: TradingView.com
Full disclosure: long QQQ puts, long SPY calendar call spread, long IWM call spread
FOLLOW Dr. Duru’s commentary on financial markets via StockTwits, Twitter, and even Instagram!
*Charting notes: Stock prices are not adjusted for dividends. Candlestick charts use hollow bodies: open candles indicate a close higher than the open, filled candles indicate an open higher than the close.

2 thoughts on “CPI Shocker Unplugs Market’s Breakout – The Market Breadth”