Stock Market Commentary:
The confluence of market-moving news the last two days of the week resolved into a stock market looking incrementally healthier. A synchronized breakout above resistance at respective 50-day moving averages (DMAs) flipped the script on the negative sentiment that dominated trading going into last week. While weakness in the U.S. dollar from Bank of Japan jawboning and a reiteration from Powell about the Fed’s anti-inflation determination occupied the headlines, a long-time reader brought economic news to my attention that I consider most important of all.
The Institute for Supply Management (ISM) reported a services PMI (Purchasing Managers Index) that further contradicted the notion that the U.S. economy is already in the recession that Wall Street wants. After 3 monthly declines, the PMI increased two straight months with August’s data. With pricing pressures apparently easing, “peak Fed” sentiment could follow the Fed’s anticipated 75 basis points hike later this month. If so, the market could enjoy a (surprising) goldilocks scenario of an economy that managed to survive aggressive tightening with the worst of rate hikes in the rearview mirror. Even if new economic trouble lies ahead, near-term anticipation of “peak Fed” could be sufficient to keep the market floating higher going into the September Fed meeting.
The Stock Market Indices
The S&P 500 (SPY) led the way forward with the synchronized breakout. Three straight days of buying ended with a 1.5% gain on Friday and a 50DMA breakout. The failure of sellers to plunge the S&P 500 back into bear market territory signals the potential for a sustainable higher low. This new momentum puts the index on track to rechallenge its 200DMA resistance in coming weeks.

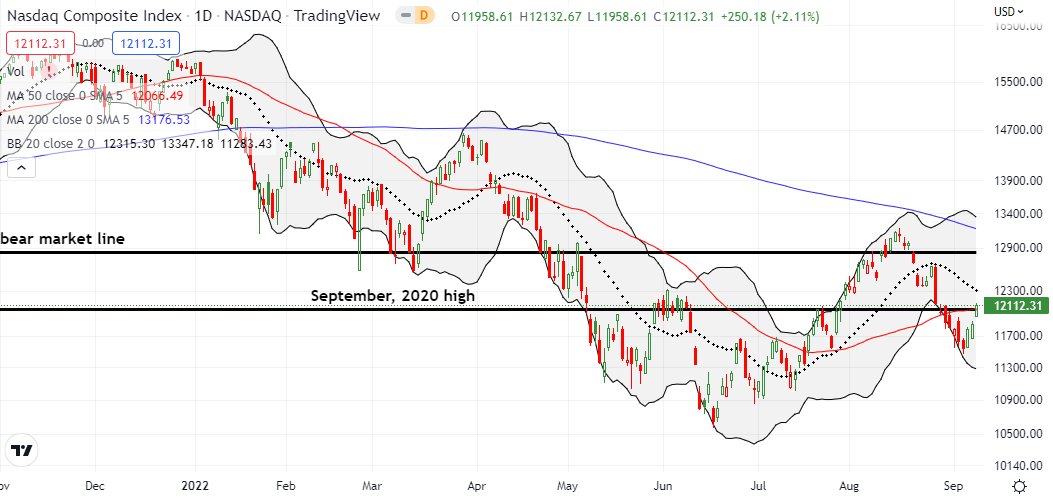
The NASDAQ (COMPQ) also enjoyed three straight days of buying. A 2.1% gain on Friday punched the tech-laden index above resistance at its converged 50DMA and September, 2020 highs. Follow-through buying would confirm the breakout and put the NASDAQ in play for a fresh challenge of its bear market line.
The iShares Russell 2000 ETF (IWM) contributed the most convincing move to the synchronized breakout. IWM gapped above 50DMA resistance and kept moving higher from there. I moved quickly after the open to get an October call spread in place to play a run toward 200DMA resistance.

Stock Market Volatility
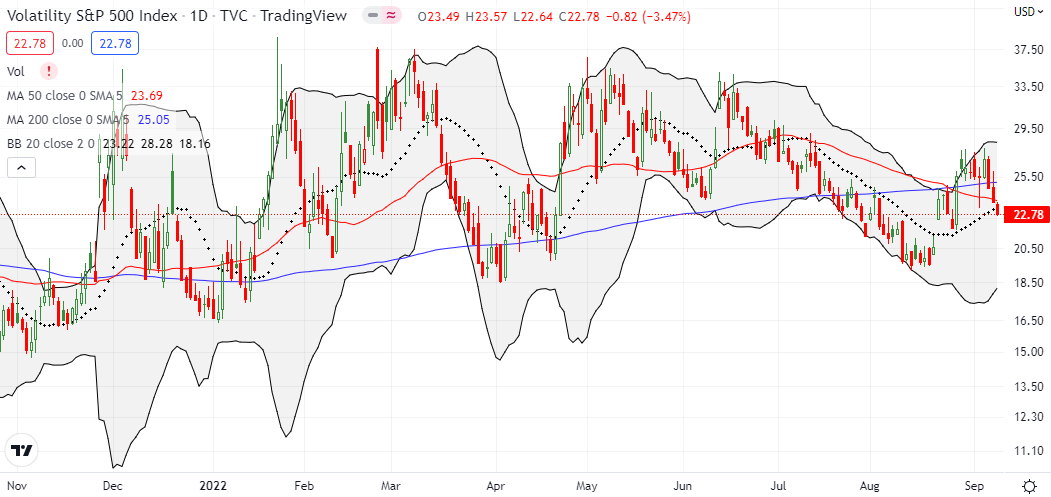
The volatility index (VIX) gave up its breakout. Friday’s 3.5% loss opens up a bigger porthole for bulls and buyers. A return to a test of the all-important 20 level is now in the cards.
The Short-Term Trading Call With A Synchronized Breakout
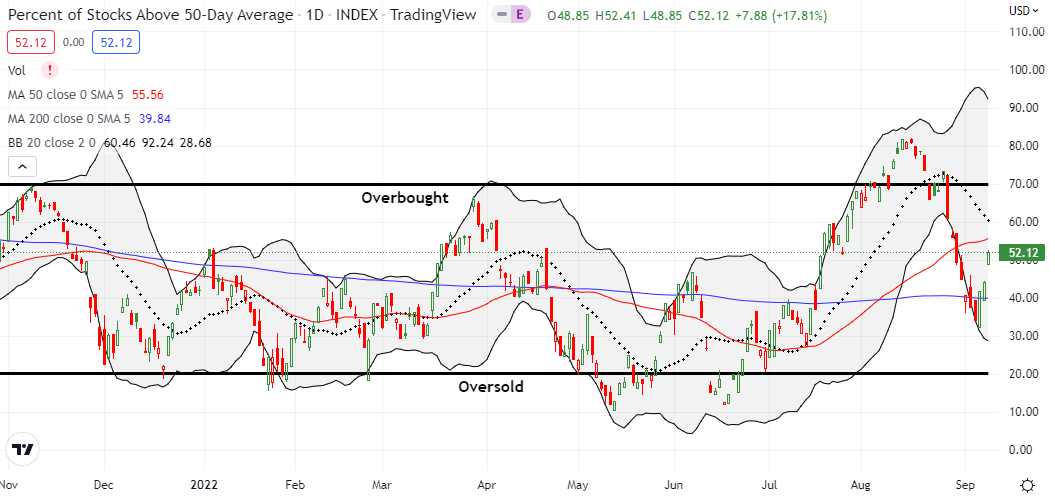
- AT50 (MMFI) = 52.1% of stocks are trading above their respective 50-day moving averages
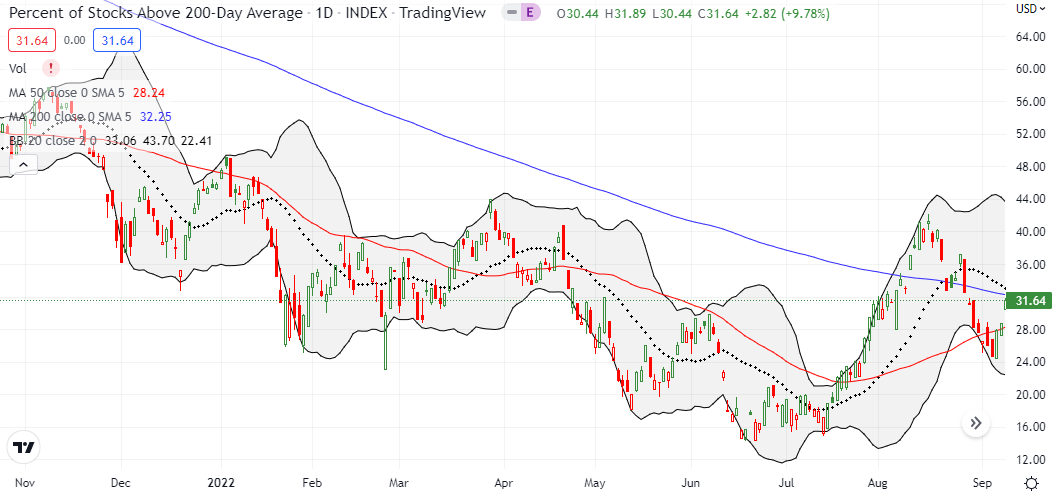
- AT200 (MMTH) = 31.6% of stocks are trading above their respective 200-day moving averages
- Short-term Trading Call: neutral
AT50 (MMFI), the percentage of stocks trading above their respective 50DMAs, underlined the synchronized breakout with a convincing surge from 44% to 52%. The surge confirmed the “close enough to oversold” bottom of the latest market cycle. Accordingly, as planned, I flipped the script on my short-term trading call from (cautiously) bearish to neutral without waiting for confirmation of the synchronized breakout. While I moved quickly to buy the IWM call spread, I also added one last bearish position. I paired the surviving long side of my QQQ calendar put spread with one more put. I see no reason to make any more bearish moves until either a) a fresh 50DMA breakdown and/or b) another failed test of overhead resistance at the 200DMA by the S&P 500.
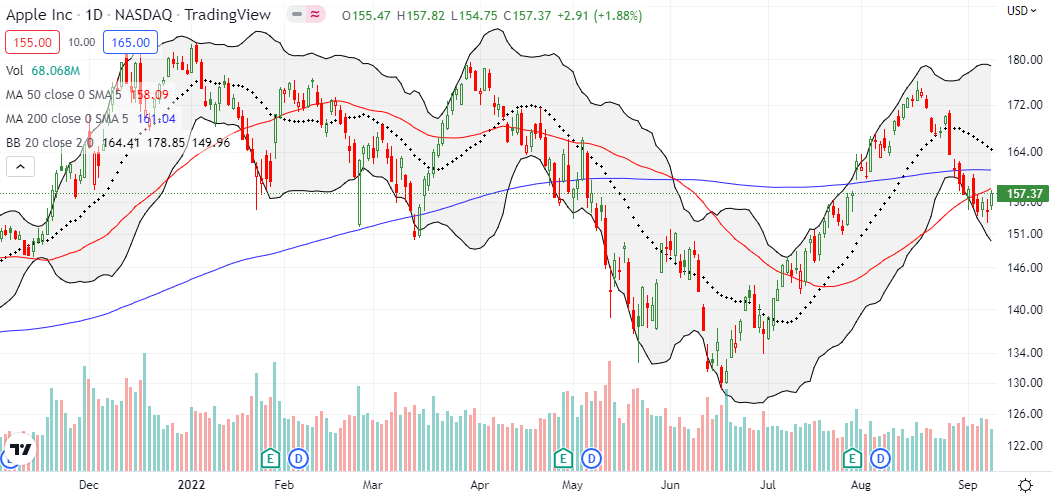
In another flip of the script, Apple Inc (AAPL) fell behind the market on a technical basis. Its failure to join the synchronized breakout signals that buyers still have a little more work ahead to create a completely convincing flip of the script on sentiment.
Be careful out there!
Footnotes
“Above the 50” (AT50) uses the percentage of stocks trading above their respective 50-day moving averages (DMAs) to measure breadth in the stock market. Breadth defines the distribution of participation in a rally or sell-off. As a result, AT50 identifies extremes in market sentiment that are likely to reverse. Above the 50 is my alternative name for “MMFI” which is a symbol TradingView.com and other chart vendors use for this breadth indicator. Learn more about AT50 on my Market Breadth Resource Page. AT200, or MMTH, measures the percentage of stocks trading above their respective 200DMAs.
Active AT50 (MMFI) periods: Day #48 over 20%, Day #42 over 30%, Day #3 over 40%, Day #1 over 50% (overperiod ending 7 days under 50%), Day #9 under 60% (underperiod), Day #10 under 70%
Source for charts unless otherwise noted: TradingView.com
Full disclosure: long QQQ puts, long SPY put, long IWM call spread
FOLLOW Dr. Duru’s commentary on financial markets via StockTwits, Twitter, and even Instagram!
*Charting notes: Stock prices are not adjusted for dividends. Candlestick charts use hollow bodies: open candles indicate a close higher than the open, filled candles indicate an open higher than the close.


