
Stock Market Commentary:
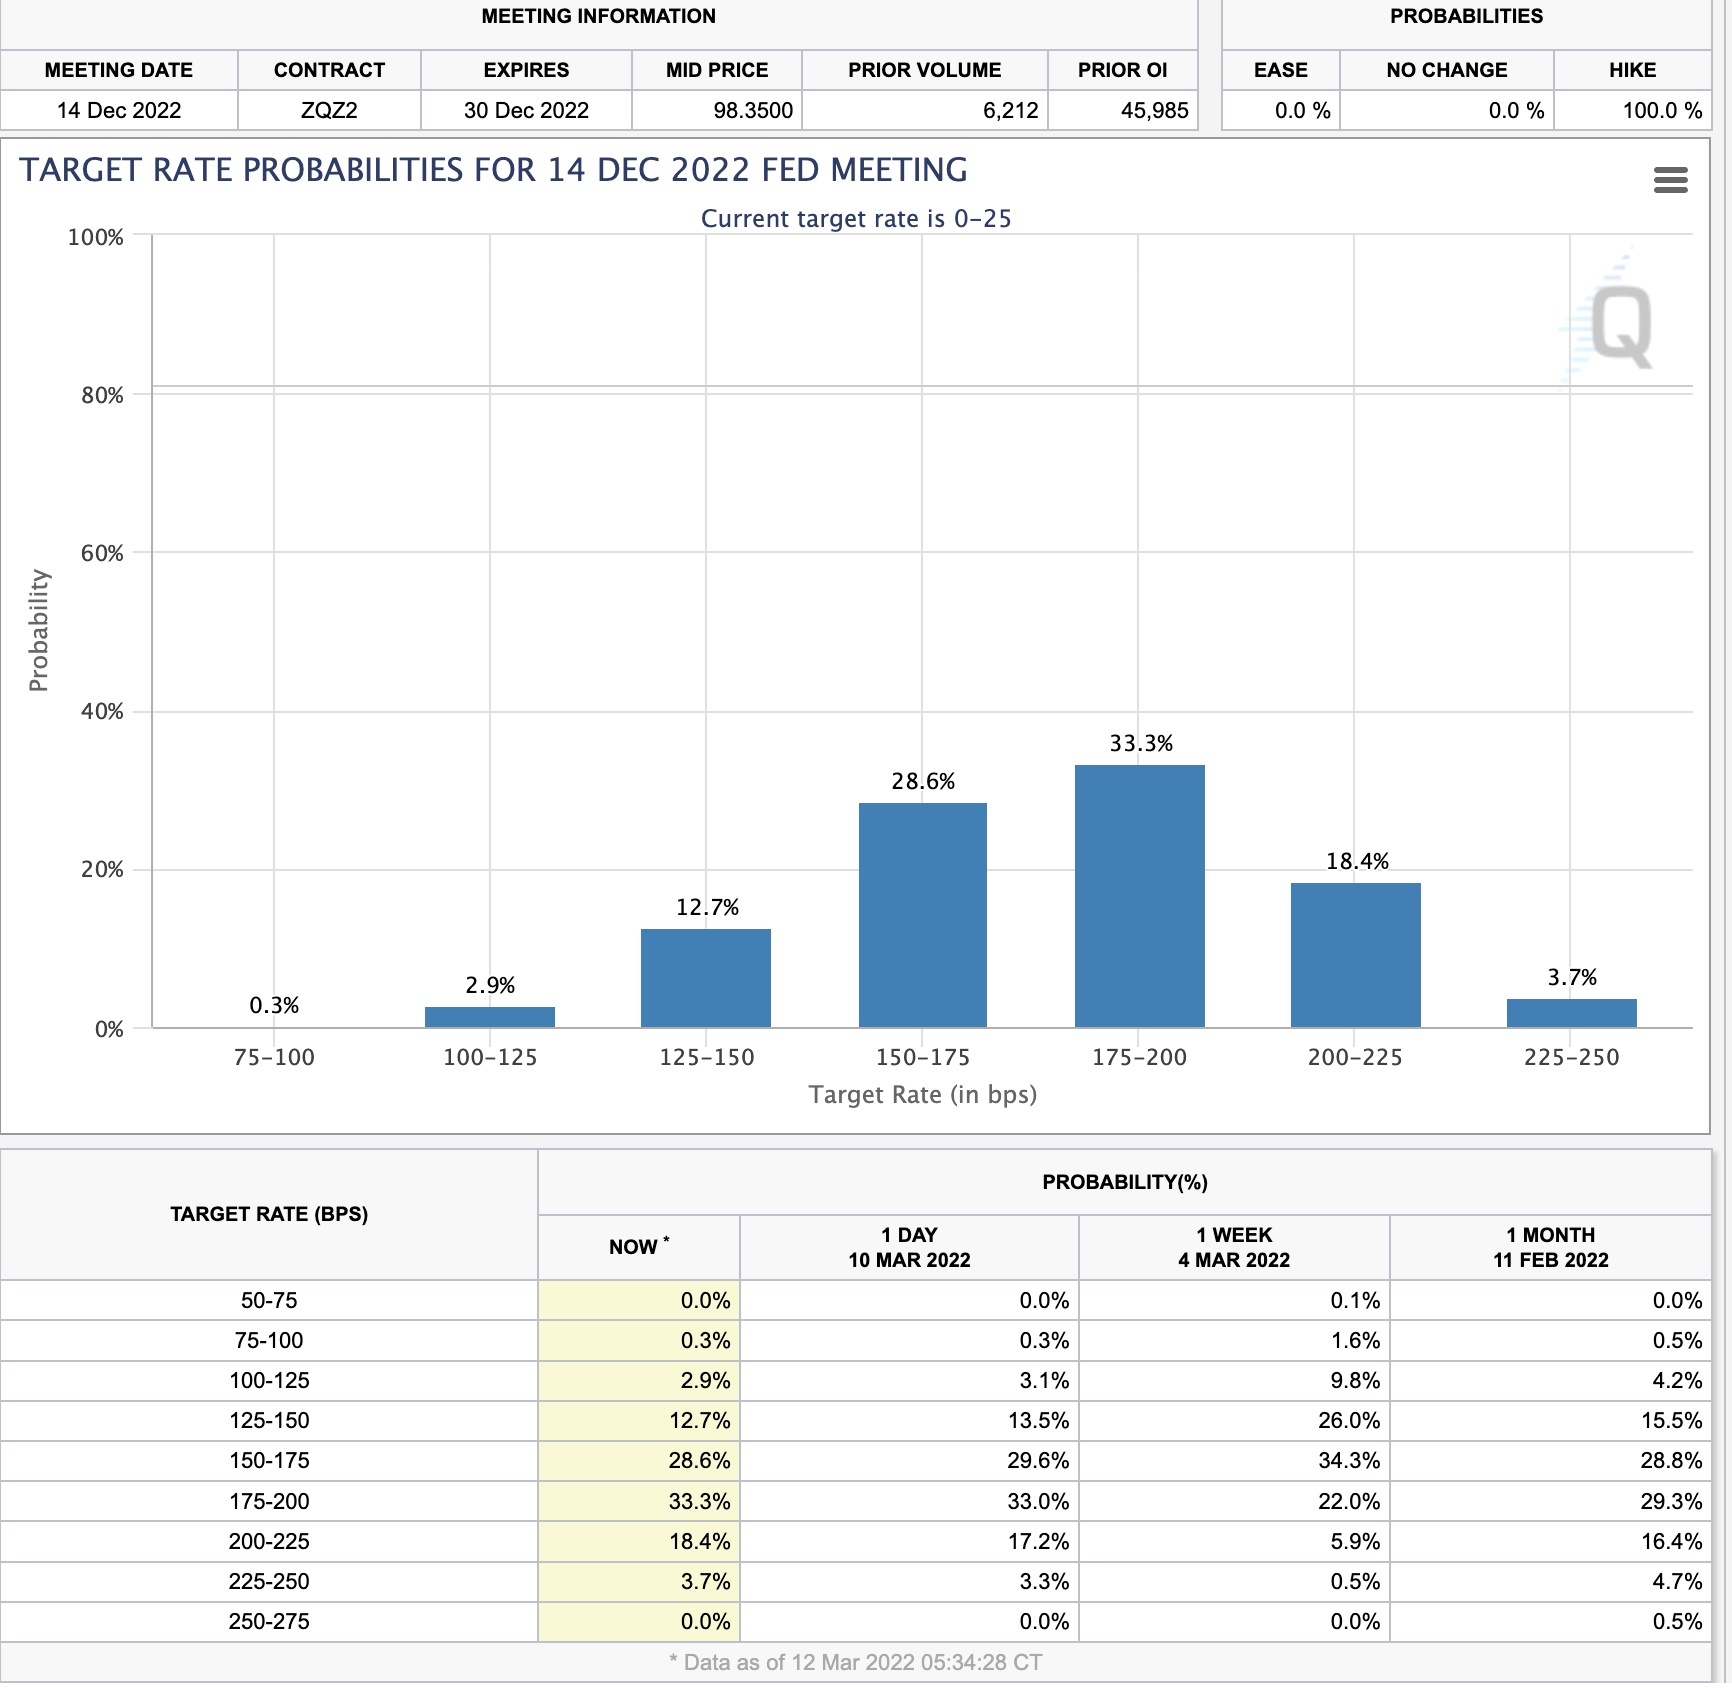
The fresh sag in the S&P 500 and the NASDAQ makes the stock market look like it is running low on fuel. The damage is timely just ahead of the next meeting of the Federal Reserve. In these circumstances, I would expect the Fed to deliver soothing words to the stock market and perhaps even promise or deliver fresh bouts of easy money monetary policy. Unfortunately, this time is truly different. The Fed is supposed to continue the glacial pace of normalizing monetary policy but finds itself more trapped than ever.
Inflation is soaring. Prices promise to remain elevated for many months to come as the global economic order gets turned upside down by World War Three. The economic saber-rattling between China and the U.S. over Russian sanctions promises to make an awful situation yet worse. The Fed may want to slash rates to negative levels and print a fresh trillion or so to load up on assets, but such a move would help send high prices even higher. If the Fed does nothing, borrowers can use rock bottom rates and an otherwise healthy economy to arbitrage inflation by buying on the cheap in order to chase scarcity. More and more money chasing fewer and fewer goods is the classic inflation dynamic. If the Fed continues as previously planned, a rapid descent into a recession seems like a lock.
The Fed has few reserves and no good options for dealing with today’s challenges. The Fed’s worst collective fear is to receive blame for another economic calamity. Yet, the Fed has boundless creativity. I cannot wait to see what happens this time around…especially given financial markets still expect the Fed to aggressively pursue rate normalization this year.
The Stock Market Indices
The S&P 500 (SPY) dropped 4 of 5 trading days last week. A 2.6% one-day gain gave the index enough buffer to avoid closing out at the lows of the week. That low of the week was also the closing low of the year and a 9-month low. I was tempted to buy into Monday’s 3.0% drop and even the next day’s 0.7% loss, but AT50 (see below) was nowhere near oversold. After the subsequent one-day rally fizzled, I refreshed my SPY call spread on Friday as I do not want to go into any given week without some kind of long position to play for a bounce. Still, I strongly prefer at this point to wait for oversold readings to do any major buying.
")
The NASDAQ (COMPQX) entered and stayed in bear market territory last week. A technical bear market starts once an equity falls 20% from its all-time high. Unlike the last trip (that created the 2022 intraday low), there was no celebratory buying by the algorithms and traders who automatically pounce on such milestones. The tech-laden index ended the week with a complete reversal of all its gains from 2021. Now the 2022 intraday low is in play as a test of support. Like SPY, I went ahead and refreshed my QQQ call position “in case” buyers get ahead of the imminent test of support.
Relative to the other major indices, the iShares Russell 2000 ETF (IWM) looks quite comfortable in its churn. Monday’s 2.5% loss stopped short of testing the February closing low. Friday’s 1.6% loss stopped far short of testing Monday’s low. Small caps look like a notable contributor to keeping AT50 and AT200 (see below) aloft and out of oversold territory.
Stock Market Volatility
Somehow the volatility index (VIX) closed down 3.9% for the week. After soaring 14.0% on Monday, the VIX slid three straight days. Friday’s rebound off intraday lows maintained the steep uptrend for the VIX. Accordingly, I see no positive signal to salvage from the VIX’s behavior. I still think the VIX will have at least one more large surge to new (intraday) highs before this cycle ends. That outlook helped return me to hedges on Friday.
The Short-Term Trading Call While Running Low On Fuel
- AT50 (MMFI) = 33.1% of stocks are trading above their respective 50-day moving averages
- AT200 (MMTH) = 31.8% of stocks are trading above their respective 200-day moving averages
- Short-term Trading Call: cautiously bullish
AT50 (MMFI), the percentage of stocks trading above their respective 50DMAs, hit a low for the week of 29.3% on Monday. My favorite technical indicator spent the rest of the week churning in the 30s. I am quite surprised that AT50 never even tested oversold (less than 20%) territory. Yet, as trading rolled out through the week, my last tranche of hedges hit their first level profit targets. So by Friday’s trading, when I realized I needed to refresh longs, I also had to refresh some put options in ARKK. I also very belatedly reached a bit for a March $22/April 14 $24 put calendar spread in KraneShares CSI China Internet ETF (KWEB). KWEB cratered on Thursday and Friday in a renewed flurry of selling.
I could not believe the story when I heard it, so I looked for the tweet myself. Assuming these data are accurate for Fidelity’s brokerage platform, they show a stark example of undisciplined bottom-fishing. The collapse in VanEck Vectors Russia ETF (RSX) has been so thorough that the Russian ETF never opened for trading last week. Granted, it is possible shorts were covering and put option holders chose to buy shares rather than sell options into an illiquid market. Still, I am left astounded by this kind of rush to buy something just because it has fallen a lot or looks cheap in the single digits! The twitter posts on $RSX last week speak to the chaos and consternation brought on by the collapse of Russia’s market.
Another version of bottom-fishing comes from the folks buying up ARK Innovation Funds for almost three straight months. From Bloomberg:
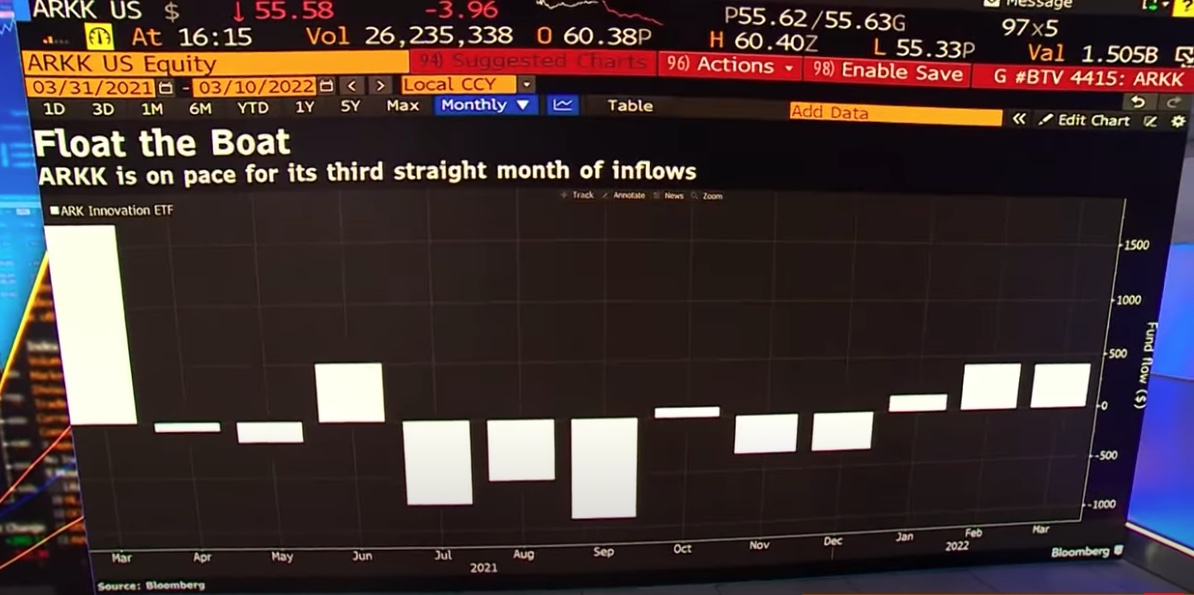
Be careful out there!
Footnotes
“Above the 50” (AT50) uses the percentage of stocks trading above their respective 50-day moving averages (DMAs) to measure breadth in the stock market. Breadth defines the distribution of participation in a rally or sell-off. As a result, AT50 identifies extremes in market sentiment that are likely to reverse. Above the 50 is my alternative name for “MMFI” which is a symbol TradingView.com and other chart vendors use for this breadth indicator. Learn more about AT50 on my Market Breadth Resource Page. AT200, or MMTH, measures the percentage of stocks trading above their respective 200DMAs.
Active AT50 (MMFI) periods: Day #479 over 20%, Day #4 over 30% (overperiod), Day #16 under 40% (underperiod), Day #46 under 50%, Day #79 under 60%, Day #259 under 70%
Source for charts unless otherwise noted: TradingView.com
Full disclosure: long QQQ call spread, long IWM call spread, long SPY call spread and short SPY call spread, long SPY, long SVXY puts, long KWEB calendar put spread, long ARKK calendar put spread and puts
FOLLOW Dr. Duru’s commentary on financial markets via StockTwits, Twitter, and even Instagram!
*Charting notes: Stock prices are not adjusted for dividends. Candlestick charts use hollow bodies: open candles indicate a close higher than the open, filled candles indicate an open higher than the close.
Regarding the Fed: perhaps there is one _tiny_ sliver of silver lining in their rate-raising? People living on incomes from a bond ladder and/or bank CDs – presumably, the majority of retirees – would benefit from ascending rates for the first time in over 15 years. Unfortunately, the nature of such incomes is that they increase only very slowly, and only after significant delay, right?
Yes. And those incomes will rise so slowly, the holders will barely notice a difference. And the hikes sure won’t cover the rising costs most of them face.