
Stock Market Commentary
The November jobs report suggested that the employment rate fell to levels last seen before the pandemic. However, the 210,000 additional jobs is well below the 1,000,000 additional jobs estimated by the U.S. household survey. This great divergence is a good metaphor for the uncertainty causing sharp and wide gyrations in the stock market. From the new normal of COVID-19 to a suddenly hawkish Federal Reserve (and an upcoming meeting) to the unrelenting budget wrangling in the Federal government, the stock market dipped into oversold territory, rebounded, and sold off again. The end result is an ugly stock market that avoided ending the week in oversold conditions while still peering over the precipice of a larger pullback.
The Stock Market Indices
The S&P 500 (SPY) is pivoting around its 50-day moving average (DMA) (the red line below). The 50DMA breakdown on Wednesday looked ugly and bearish. However, oversold trading conditions prevented me from making a bearish interpretation. Instead, I stuck with my trading rules and flipped bullish. The subsequent 1.4% oversold bounce vindicated the decision, but clearly the S&P 500 is not yet out of the woods. A close below last week’s low could usher in an (ugly) extended oversold period. If so, staying bullish will require patience and additional risk management measures (like hedging). Regardless, I am assuming the market has suffered sufficient technical damage to create a sustained top.
The NASDAQ (COMPQX) suffered more than the S&P 500 from a technical viewpoint. The tech-laden index ended the week with a 50DMA breakdown. Its collection of expensive growth stocks quickly fell out of favor last week and led the way to creating an ugly print. The NASDAQ is even a lower close away from throwing up a red flag of risk aversion for the rest of the stock market. Despite the breakdown, I bought a weekly calendar call spread to play the optimistic oversold scenario of a recovering NASDAQ in 2 weeks.
The iShares Russell 2000 ETF (IWM) churned like the S&P 500 but without any important breakdowns in between. I bought an IWM call spread to play an eventual bounce away from the bottom of the trading range (shown by the horizontal black lines).
Stock Market Volatility
The volatility index (VIX) surprised me with a fresh surge on Wednesday. The VIX almost surprised me again on Friday but faders managed to prevent the VIX from printing a new 9-month high. The VIX’s sustained elevation is ugly and clearly a red flag. The VIX has not been able to stay so elevated for so long all year. However, while this strength suggests a deeper than usual loathing and fear for the stock market, the elevation also creates the buying opportunity coming out of the last oversold period or future oversold periods. Faders will eventually generate a VIX pullback or even an implosion. That move should in turn be associated with a healthy bounce for a number of stocks.
The Short-Term Trading Call While Oversold and Ugly
- AT50 (MMFI) = 25.8% of stocks are trading above their respective 50-day moving averages
- AT200 (MMTH) 38.2% of stocks are trading above their respective 200-day moving averages
- Short-term Trading Call: bullish
AT50 (MMFI), the percentage of stocks trading above their respective 50DMAs, closed the week at 25.8%. I expected a drop back into oversold territory (below 21%) given all the selling on the day. The ability to avoid a new oversold reading is a bit of make-up for an otherwise ugly stock market. Fortunately, AT200 avoided a fresh 17-month low and added some more make-up to the ugly trading.
I fully recognize that “this time” could be different for this dip in the stock market. At a minimum, it seems odd to get excited about a buying opportunity while the S&P 500 is just 4% off its all-time high, and the NASDAQ is below 50DMA support. Still, I prefer to stick to the trading rules. Those trading rules include contingencies for dealing with an extended oversold period even like the historic oversold trading period associated with the pandemic-driven collapse. Moreover, I expect the 50 and 200DMAs on the S&P 500 to continue to provide good measures of support, resistance, and over-extended selling pressure.
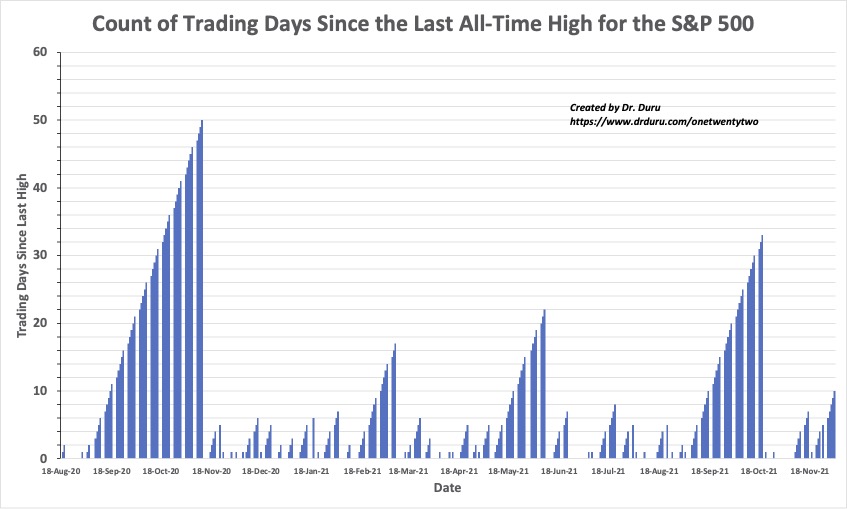
The S&P 500 All-Time Highs
The S&P 500’s uptrend has been amazingly strong since the pandemic lows. The chart below is another measure of that strength. Since the first pandemic all-time high in August, 2020, the S&P 500 has spent at most 50 trading days trading below its all-time high. That period was over a year ago. Since then, the S&P 500 has tended to trade at or near its all-time high for long stretches. I am using the 333 straight days below the all-time highs from the last dip as a measure for a “sustained” top for this latest dip.
Be careful out there!
Footnotes
“Above the 50” (AT50) uses the percentage of stocks trading above their respective 50-day moving averages (DMAs) to measure breadth in the stock market. Breadth defines the distribution of participation in a rally or sell-off. As a result, AT50 identifies extremes in market sentiment that are likely to reverse. Above the 50 is my alternative name for “MMFI” which is a symbol TradingView.com and other chart vendors use for this breadth indicator. Learn more about AT50 on my Market Breadth Resource Page. AT200, or MMTH, measures the percentage of stocks trading above their respective 200DMAs.
Active AT50 (MMFI) periods: Day #412 over 21% (overperiod), Day #4 under over 31% (underperiod), Day #6 under 40%, Day #10 under 51%, Day #12 under 60%, Day #192 under 72%
Source for charts unless otherwise noted: TradingView.com
Full disclosure: long SVXY, long IWM call spread, long QQQ calendar call spread, long SPY call spread, short SPY put spread
FOLLOW Dr. Duru’s commentary on financial markets via StockTwits, Twitter, and even Instagram!
*Charting notes: Stock prices are not adjusted for dividends. Candlestick charts use hollow bodies: open candles indicate a close higher than the open, filled candles indicate an open higher than the close.