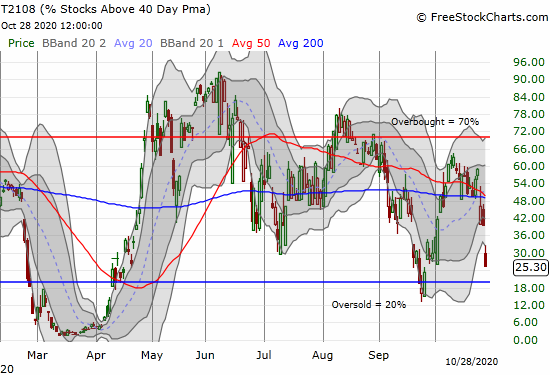
The week started with key support at the 50-day moving average (DMA) giving way for the S&P 500 (SPY). The meltdown started into a crescendo today with 50DMA breakdowns across indices. The selling was swift enough to drive my favorite technical indicator close to oversold levels. AT40 (T2108), the percentage of stocks trading above their respective 40DMAs, closed at 25.3%, just above the 20% threshold that defines oversold conditions.
The broad sell-off was distinctly bearish in nature. The S&P 500 lost 3.5%, closed below its lower Bollinger Band (BB), and confirmed a 50DMA breakdown. The NASDAQ (COMPQX) lost 3.7% on a 50DMA breakdown. The iShares Russell 2000 ETF (IWM) lost 3.1% on a 50DMA breakdown. The Financial Select Sector SPDR Fund (XLF) lost 2.7% and confirmed a 50DMA breakdown.
The losses were deep enough to send AT200 (T2107), the percentage of stocks trading above their respective 200DMAs, all the way back to 43.3%. More importantly, this important indicator of long-term health in the market stopped short of an important downtrend line. This downtrend has been in place since AT200 peaked in the immediate aftermath of the financial crisis. That downtrend is a long-term red flag on the slow erosion of breadth in the stock market.
Despite the carnage, I am not interested in chasing stocks downward with short positions. I remain cautiously bullish, and I am looking to start buying according to my AT40 trading rules on oversold conditions (or “close enough”). Accordingly, I sold almost all my hedging positions in put options and shares in ProShares Ultra VIX Short-Term Futures ETF (UVXY).
Be careful out there!
Full disclosure: no positions


