AT40 = 60.2% of stocks are trading above their respective 40-day moving averages (DMAs)
AT200 = 55.2% of stocks are trading above their respective 200DMAs
VIX = 12.1
Short-term Trading Call: neutral
Stock Market Commentary
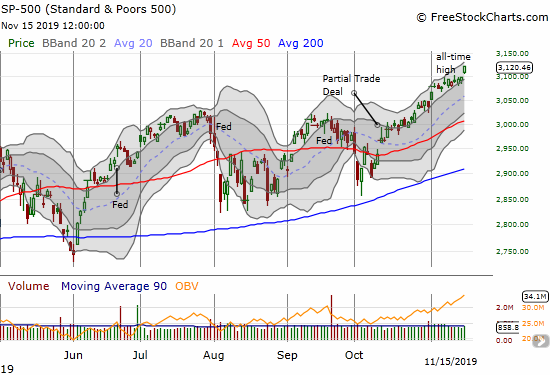
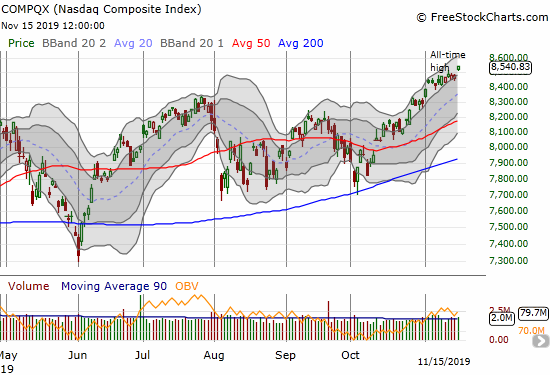
The stock market’s slow and steady march toward Christmas continued last week. The S&P 500 (SPY) drifted slightly higher during the week until Friday’s gap up and breakout to a fresh all-time high. The 0.8% gain was underlined by AT40 (T2108), the percentage of stocks trading above their respective 40-day moving averages (DMAs), jump to 60.2%. While AT40 remains below its high for the month at 63.7%, the move ended the growth in bearish divergence in the stock market.
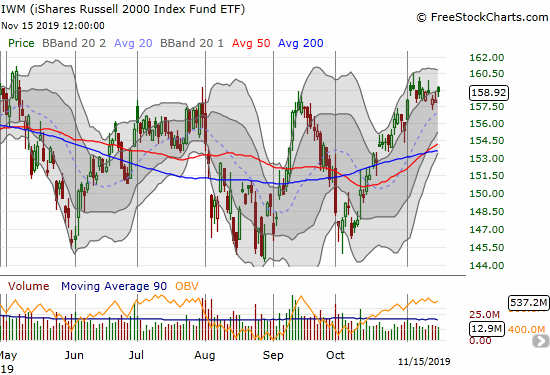
The iShares Russell 2000 Index Fund ETF (IWM) is still struggling to print its own breakout. I bought call options in IWM as a “catch-up” trade assuming that IWM will eventually rise with the greater bullish tide in financial markets.
Volatility
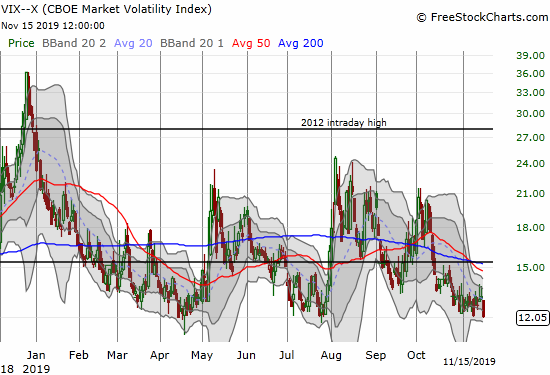
As the S&P 500 drifted a bit higher, the volatility index (VIX) did as well. The stealthy rise in the VIX supported the setup of a bearish divergence. Friday’s plunge in the VIX supported the notion that the bearish divergence has stopped growing. Complacency freshly stepped into the breach.
I would prefer to get bullish on the S&P 500’s breakout, but I see the lag in AT40 as an on-going warning sign. Now that AT40 has crossed the 60% threshold, I think the clock is winding down toward 70%, the overbought threshold. I am bracing for this line to hold as resistance for the latest rally. Again, I think the next pullback will be relatively mild given November and December are the “safest” months of the year in terms of average maximum drawdowns.
Stock Chart Reviews – Below the 50DMA
Match Group (MTCH)
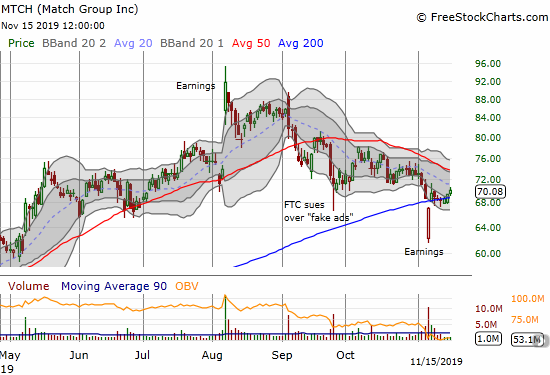
“Catch-up” stocks are interesting to consider at this time of year. Match (MTCH) looks like a catch-up stock given it is down 23.6% from its all-time high, sports a massive 66.6% short interest (on its float), and rapidly recovered from a big post-earnings gap down. The subsequent gap up left behind a pattern akin to an abandoned baby bottom. This pattern left behind overly aggressive sellers. Now that the stock is creeping over its 200DMA, a tradeable bottom looks confirmed.
Whirlpool (WHR)
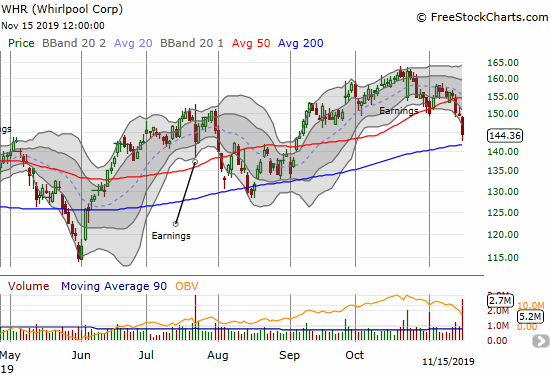
Last month, Whirlpool (WHR) attempted its own post-earnings recovery from aggressive sellers. Unfortunately, the buying came to a screeching halt. A subsequent bounce off 50DMA support provided brief hope until a fresh 50DMA breakdown led to Friday’s high-volume 3.7% loss. With the stock much higher than its last 200DMA test, I am looking to go short on a 200DMA breakdown.
Stock Chart Reviews – Above the 50DMA
J.C. Penney (JCP)
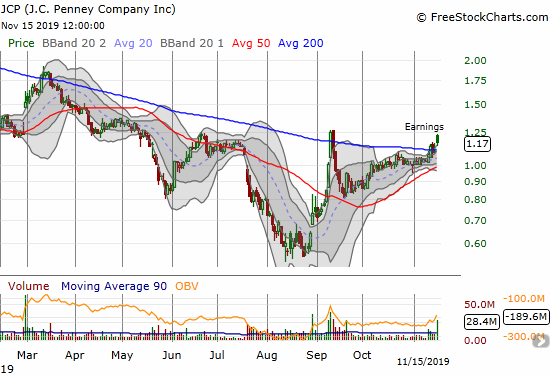
Retailer J.C. Penney (JCP) has been in trouble for a very long time. JCP has steadily lost altitude since 2012. That peak marked the end of a feeble rally out of the financial crisis. Now JCP is struggling to say above the critical $1 mark. After plunging below $0.60 in August, the stock has doubled in the wake of a post-earnings gap up. I like the current 200DMA breakout much better than the previous two. The 50DMA is squeezing higher, and it provided support for the cooling period after September’s parabolic run-up. The stock is a buy here (another catch-up stock) with a stop below the 50DMA. An initial upside target is the March high.
Comscore (SCOR)
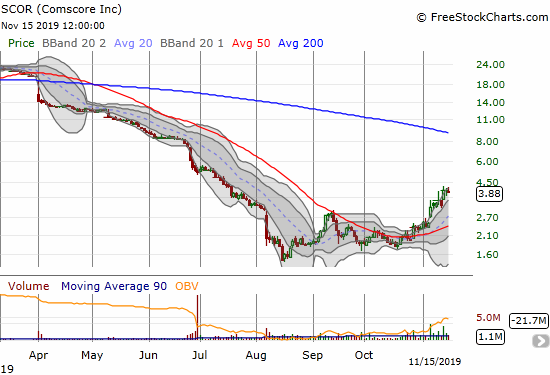
Internet measurement company Comscore (SCOR) is another stock that long fell from grace. After an accounting scandal and rotating executives, the stock looks like it finally bottomed in August. The stock rallied sharply from the October 50DMA breakout and last week news came out about broad-based insider buying in the stock. I traded in and out of SCOR in August. I bailed after the 50DMA held as stiff resistance. Now, resistance looks far away at the 200DMA.
The Kraft Heinz Company (KHC)
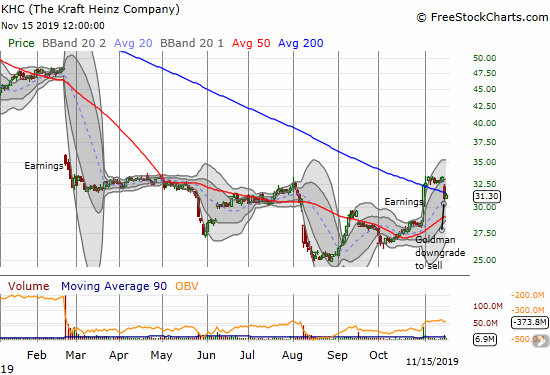
Goldman Sachs brought an abrupt end to a post-earnings 200DMA breakout for The Kraft Heinz Company (KHC). When I pointed out the move I described it as unconvincing and at risk of a reversal. Goldman obliged with its downgrade. Now, I will readily treat the downgrade as a fortuitous discount if KHC manages confirm a fresh 200DMA breakout.
Walmart (WMT)
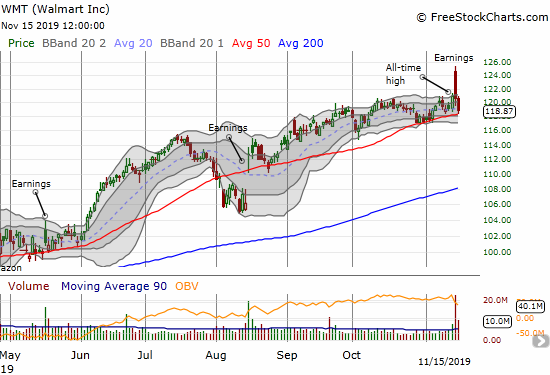
Walmart (WMT) caught my attention because of its sharp post-earnings gap and crap. The selling was severe enough that the stock even closed slightly negative and failed to notch a fresh all-time high. Sellers quickly followed up on Friday with a push into 50DMA support. I suspect this support will hold up for a while, but the topping pattern is compelling here.
— – —
FOLLOW Dr. Duru’s commentary on financial markets via email, StockTwits, Twitter, and even Instagram!
“Above the 40” uses the percentage of stocks trading above their respective 40-day moving averages (DMAs) to assess the technical health of the stock market and to identify extremes in market sentiment that are likely to reverse. Abbreviated as AT40, Above the 40 is an alternative label for “T2108” which was created by Worden. Learn more about T2108 on my T2108 Resource Page. AT200, or T2107, measures the percentage of stocks trading above their respective 200DMAs.
Active AT40 (T2108) periods: Day #213 over 20%, Day #52 over 30%, Day #27 over 40%, Day #24 over 50%, Day #1 over 60% (overperiod ending 7 days under 60%), Day #40 under 70%
Daily AT40 (T2108)

Black line: AT40 (T2108) (% measured on the right)
Red line: Overbought threshold (70%); Blue line: Oversold threshold (20%)
Weekly AT40 (T2108)

*All charts created using FreeStockCharts unless otherwise stated
The T2108 charts above are my LATEST updates independent of the date of this given AT40 post. For my latest AT40 post click here.
Be careful out there!
Full disclosure: long VIXY calls
*Charting notes: FreeStockCharts stock prices are not adjusted for dividends. TradingView.com charts for currencies use Tokyo time as the start of the forex trading day. FreeStockCharts currency charts are based on Eastern U.S. time to define the trading day.
