
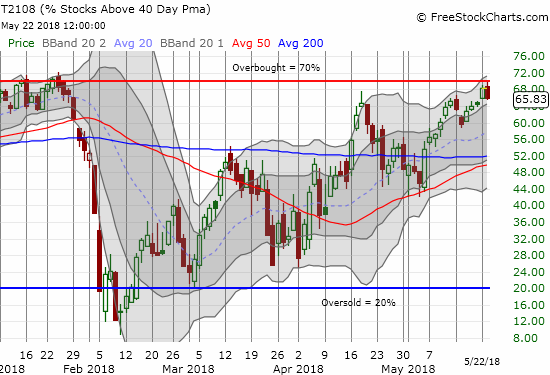
AT40 = 65.8% of stocks are trading above their respective 40-day moving averages (DMAs) (hit a high at 69.7%)
AT200 = 51.5% of stocks are trading above their respective 200DMAs
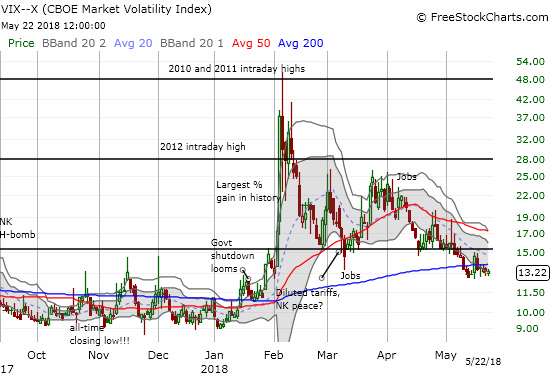
VIX = 13.4
Short-term Trading Call: neutral
Commentary
The stock market keeps crossing up as headlines and macro events push the market one way and then the other.
Shaun Livingston crosses up James Harden and throws it down. pic.twitter.com/4m1BddWfen
— MyNBAUpdate (@MyNBAUpdate) May 21, 2018
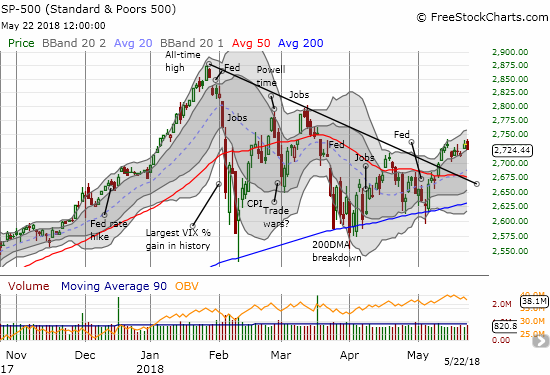
The big slam has yet to come in the form of a definitive breakout or breakdown. Since the January all-time high, the S&P 500 (SPY) has chopped widely and sometimes wildly. If not for the context, I would have claimed the chart below is quite encouraging. The S&P 500 has held a breakout above its 50-day moving average (DMA) for the longest period since the February swoon – now 10 days and counting. The index broke out from its short-term downtrend from the all-time high. Moreover, this latest move is the FIRST time the index has managed to trade higher than its high the day of a Fed monetary policy meeting.
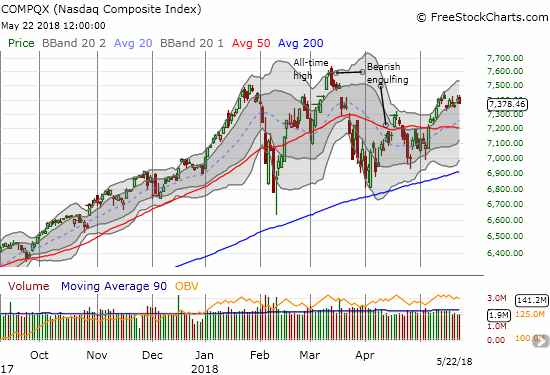
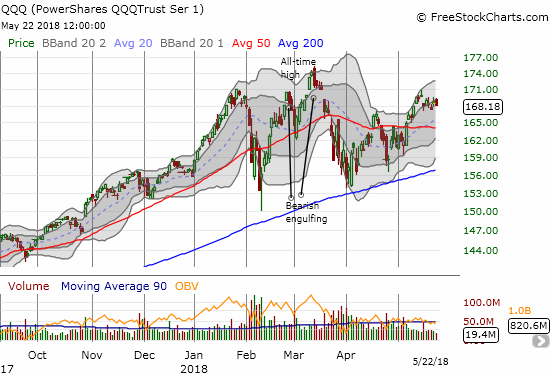
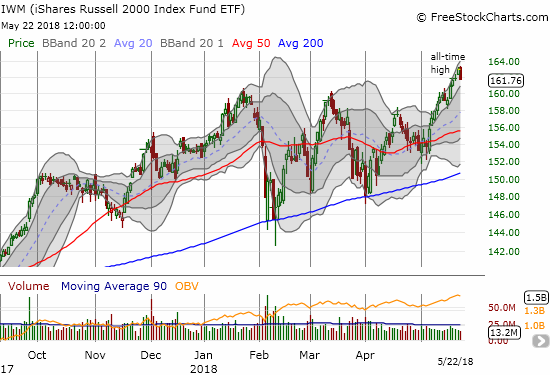
The NASDAQ and PowerShares QQQ ETF (QQQ) are also holding breakouts, granted these moves are much less impressive than their abilities to mark new all-time highs in the first bounceback from the February swoon. The iShares Russell 2000 ETF (IWM) is still impressive despite a 0.7% pullback from an all-time high – a move that may have ended the upward momentum for May.
Yet, here on the cusp of confirming broad bullishness, the stock market is failing. Buyers still cannot muster enough force to push the market into overbought territory as defined by AT40 (T2108), the percentage of stocks trading above their respective 40DMAs. AT40 above 70% marks an overbought market. On Tuesday, AT40 got as high as 69.7%. In the AT40 playbook, today’s action is mildly bearish. A further pullback from current levels will confirm a bearish change in sentiment.
Laying in wait for a decision is the volatility index, the VIX. The fear gauge looks like it is finally tired of going down. It has held its ground for 8 trading days. Combined with AT40’s ominous pullback, I loaded up on ProShares Ultra VIX Short-Term Futures (UVXY) call options.
Given the headlines and macro events, I recognize that the technicals could all change again in a flash. However, given the market’s record on pullbacks from the overbought threshold, I am putting the buyers and the bulls in the “show me” box.
The currency market confirmed new yellow flags. The Swiss franc (FXF) suddenly keeps getting stronger. The Australian dollar versus the Japanese yen (AUD/JPY) dropped sharply on the day. At the time of writing, this important indicator of sentiment is still selling off vigorously.
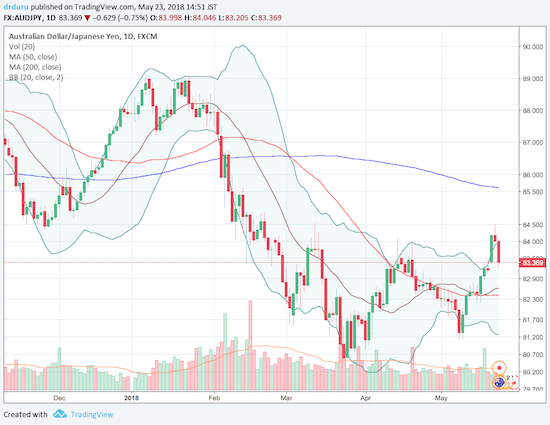
Source: TradingView.com
CHART REVIEWS
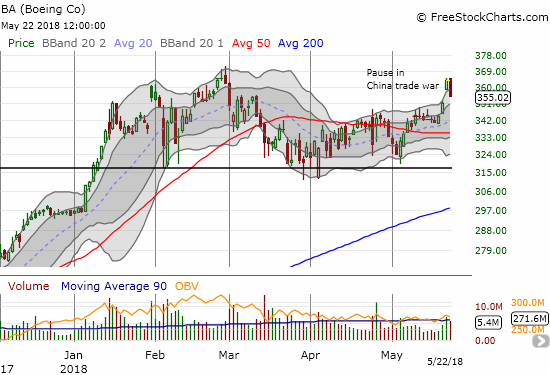
Boeing (BA)
BA is right back in the hotseat. After the stock gapped up and gained 3.6% on news that the U.S. and China hit the pause button on trade war tariffs, BA appeared to confirm the bullish tidings I described in the last AT40 post. The trade fairies giveth, and they taketh away. With President Trump refreshing the specter of trade disagreements, BA went into freefall. I was quick to jump on a put option ahead of BA’s close and a loss of 2.5% on the day…Monday’s gap is almost filled.
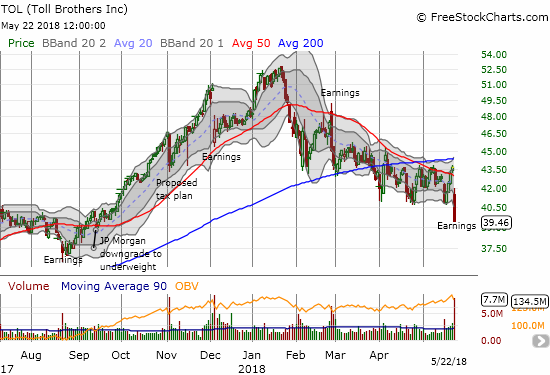
Toll Brothers (TOL)
Perhaps the most disappointing news on the day was the market’s reaction to TOL’s earnings. The stock lost an incredible 9.6% to close at an 8-month low. TOL’s big breakout in September is completely gone now. The bearish sentiment and trading action made me very relieved that, as planned, I finally gave up on most of my home builder positions on Monday. I will write more about the fresh carnage in home builders in my next Housing Market Review (Five Point Holdings (FPH) is my last home builder, and I even ADDED to it).
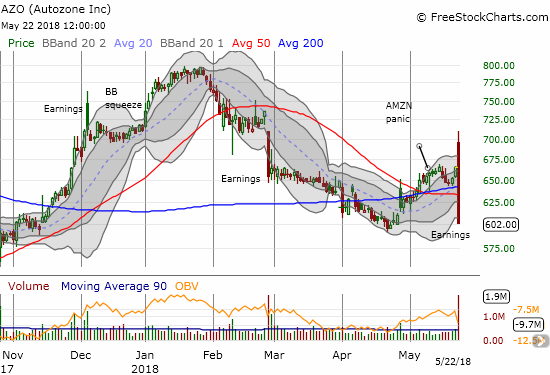
Autozone (AZO)
AZO was a whirlwind. I missed out on the call spread that I wanted to buy ahead of earnings. I kicked myself a second time when I saw the first reaction to AZO’s earnings: the stock soared right to and then past my $690 target on its way to a quick $710 intraday high! If I had a position, I would have had to sell quickly. After the conference call got underway, sellers overwhelmed the stock almost all the way to the close. AZO finished the day at its low and $602: a head-spinning 100 point swing. I decided to speculate on a call spread into the teeth of the carnage. I just need a recovery back to 50 or 200DMA resistance…
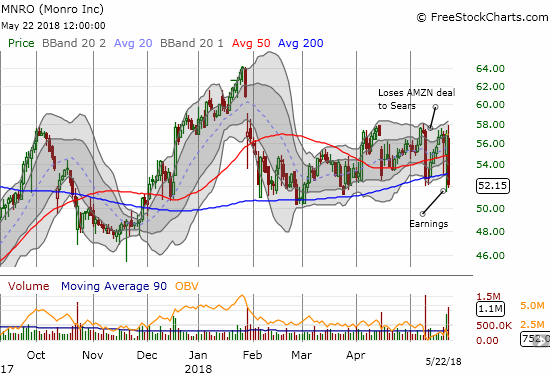
Monro (MNRO)
MNRO was another post-earnings loser. The stock is not only below its 200DMA support, but also it made a fresh post Amazon panic low. I am NOT looking to buy the dip again just yet.
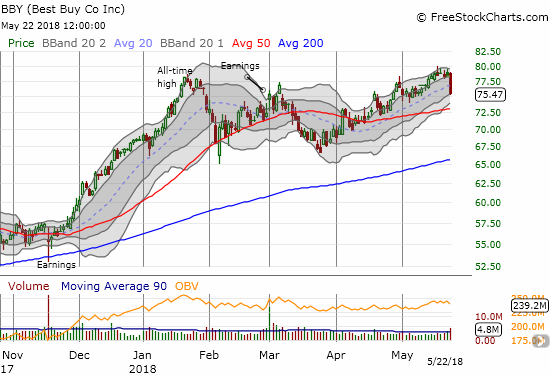
Best Buy (BBY)
Perhaps it was just a very bad day for retail with too many earnings reports for the market to properly digest. BBY was dumped for a 3.6% loss on no ostensible news. With volume picking up on the last 5 days of down trading, BBY looks like it has brought to an end the steady momentum that dominated its trading since the March low. I will be watching earnings before market on Thursday, May 24th.
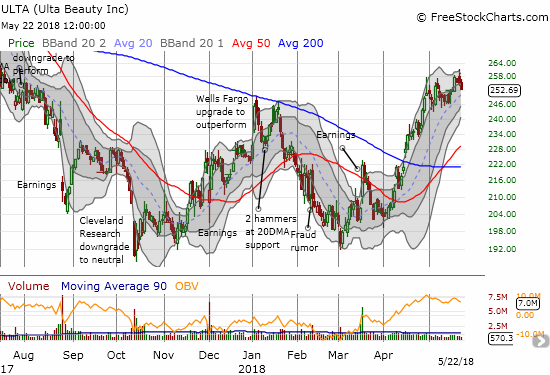
Ulta Beauty (ULTA)
Given the poor showing in retail, it was probably appropriate that I decided to take profits in ULTA. I have not liked the trading action ever since I triumphantly pointed out the breakout that I thought confirmed ULTA’s comeback. I finally got impatient with the choppy topping action and took profits here ahead of earnings on May 31st next week.
— – —
FOLLOW Dr. Duru’s commentary on financial markets via email, StockTwits, Twitter, and even Instagram!
“Above the 40” uses the percentage of stocks trading above their respective 40-day moving averages (DMAs) to assess the technical health of the stock market and to identify extremes in market sentiment that are likely to reverse. Abbreviated as AT40, Above the 40 is an alternative label for “T2108” which was created by Worden. Learn more about T2108 on my T2108 Resource Page. AT200, or T2107, measures the percentage of stocks trading above their respective 200DMAs.
Active AT40 (T2108) periods: Day #67 over 20%, Day #36 over 30%, Day #31 over 40%, Day #13 over 50%, Day #5 over 60% (overperiod), Day #81 under 70%
Daily AT40 (T2108)
")
Black line: AT40 (T2108) (% measured on the right)
Red line: Overbought threshold (70%); Blue line: Oversold threshold (20%)
Weekly AT40 (T2108)

*All charts created using freestockcharts.com unless otherwise stated
The charts above are my LATEST updates independent of the date of this given AT40 post. For my latest AT40 post click here.
Related links:
The AT40 (T2108) Resource Page
You can follow real-time T2108 commentary on twitter using the #T2108 or #AT40 hashtags. T2108-related trades and other trades are occasionally posted on twitter using the #120trade hashtag.
Be careful out there!
Additional disclosure: long UVXY calls, long BA put, long AZO call spread
*Charting notes: FreeStockCharts.com stock prices are not adjusted for dividends. TradingView.com charts for currencies use Tokyo time as the start of the forex trading day. FreeStockCharts.com currency charts are based on Eastern U.S. time to define the trading day.