
AT40 = 60.3% of stocks are trading above their respective 40-day moving averages (DMAs)
AT200 = 48.7% of stocks are trading above their respective 200DMAs
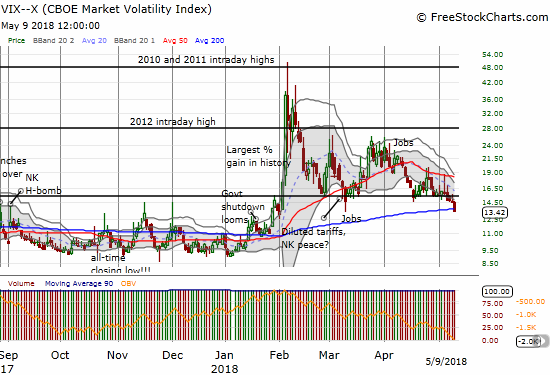
VIX = 13.4
Short-term Trading Call: neutral
Commentary
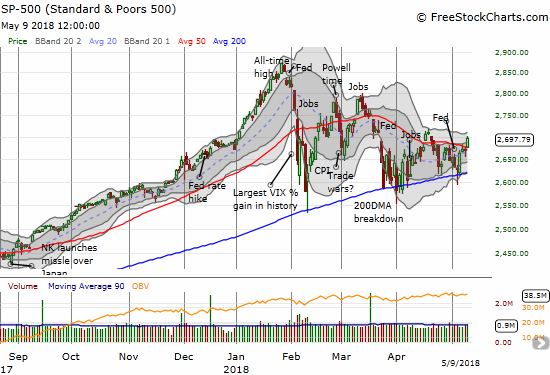
The “Apple Temptation” of the stock market seems to be working. For starters, after a 3 week run with a cautiously bearish short-term trading call, I have nudged the needle back to neutral. I perhaps overstayed the welcome a bit after the S&P 500 (SPY) completed several more successful tests of support at its 200-day moving average (DMA). Still, I may prove a bit too early as the S&P 500 (SPY) broke out above its 50DMA for the first time since mid-April, but the index has not yet punched above that mid-April high.
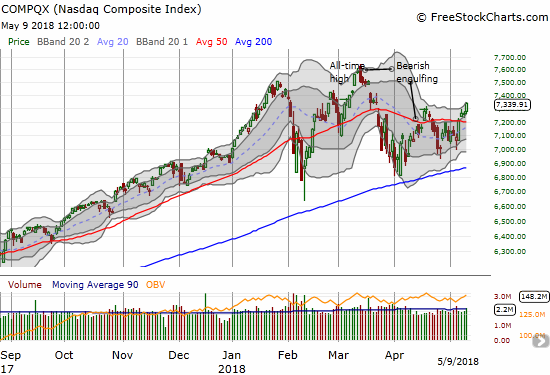
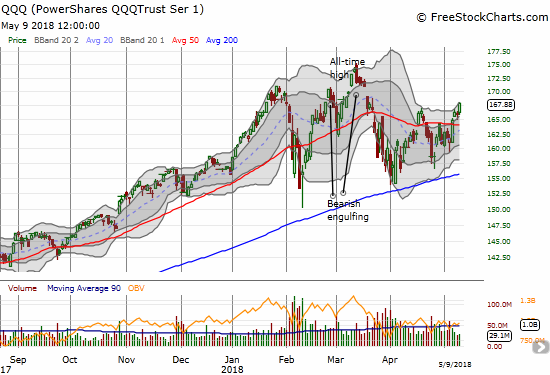
Tech stocks are once again leading the charge. Both the NASDAQ and the PowerShares QQQ ETF (QQQ) are right back in bullish territory with 50DMA breakouts last week and on Wednesday closes above the mid-April high.
Even if the S&P 500 gives in to the temptation of tech stocks with its own confirmed 50DMA breakout, I will likely keep the short-term trading call at neutral. Not only do I hate churning the trading call, but also I now need to see how my favorite technical indicator behaves near or at the overbought threshold. AT40 (T2108), the percentage of stocks trading above their respective 40DMAs, closed at 60.3%. AT40 could easily test the overbought threshold of 70% by early next week. When AT40 fell away from the overbought threshold in mid-April, my quick reaction enabled me to get (cautiously) bearish in time to make some good trades to the downside. AT40 needs to press through overbought conditions to solidify the case for enough buying power to sustain a bullish trading call.
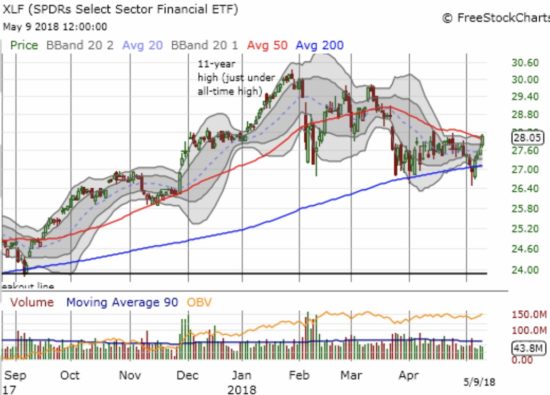
Financials are also tempering bullish sentiment. The Financial Select Sector SPDR ETF (XLF) gained a nice 1.5% on the day, but it failed to clear the April (intraday) high. Moreover, XLF is fresh off a 200DMA breakdown and barely punched above its 50DMA resistance. I WILL reload on call options if buyers follow-through on XLF and confirm the 50DMA breakout.
The volatility index, the VIX, is pointing to bullish days ahead (recall that periods of extremely low volatility are bullish for the stock market). The downtrend from the March high continued with a close well below the 15.35 pivot. The VIX lost 8.8% on the day and returned exactly to its close below the massive 2-day run-up that launched the stock market swoon in February. The stock market has some catch-up to do to align with a now rapid return of complacency in the market. I took this opportunity to essentially give up on my latest tranche of call options on ProShares Ultra VIX Short-Term Futures (UVXY) and get back to accumulating a short on iPath S&P 500 VIX ST Futures ETN (VXX).
Despite the upgrade in the trading call, I locked in my profits on my SPY shares into the breakout. I only held the shares through the mid-April high in case I turned out to be wrong on my trading call (this was the large position I accumulated off the cycles through oversold conditions in February and March swoons). Now I am happy to recover that cash to deploy to other opportunities.
CHART REVIEWS
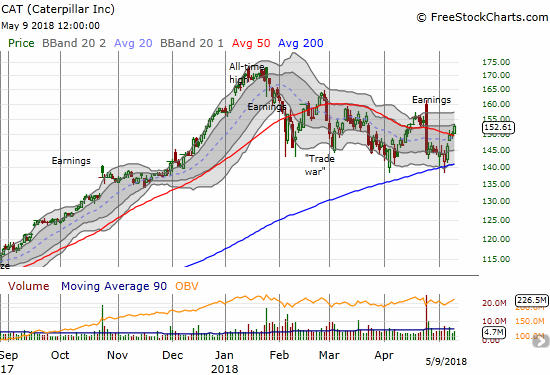
Caterpillar (CAT)
As I watch for more clues to a bullish change in sentiment, I keep a close eye on CAT. CAT confirmed its own 50DMA breakout and has almost reversed its post-earnings loss. Both moves are bullish. Still, the stock needs to climb over its post-earnings intraday high to confirm a fresh bullish outlook.
— – —
FOLLOW Dr. Duru’s commentary on financial markets via email, StockTwits, Twitter, and even Instagram!
“Above the 40” uses the percentage of stocks trading above their respective 40-day moving averages (DMAs) to assess the technical health of the stock market and to identify extremes in market sentiment that are likely to reverse. Abbreviated as AT40, Above the 40 is an alternative label for “T2108” which was created by Worden. Learn more about T2108 on my T2108 Resource Page. AT200, or T2107, measures the percentage of stocks trading above their respective 200DMAs.
Active AT40 (T2108) periods: Day #58 over 20%, Day #27 over 30%, Day #22 over 40%, Day #3 over 50%, Day #1 over 60% (overperiod ending 14 days under 60%), Day #72 under 70%
Daily AT40 (T2108)
")
Black line: AT40 (T2108) (% measured on the right)
Red line: Overbought threshold (70%); Blue line: Oversold threshold (20%)
Weekly AT40 (T2108)

*All charts created using freestockcharts.com unless otherwise stated
The charts above are my LATEST updates independent of the date of this given AT40 post. For my latest AT40 post click here.
Related links:
The AT40 (T2108) Resource Page
You can follow real-time T2108 commentary on twitter using the #T2108 or #AT40 hashtags. T2108-related trades and other trades are occasionally posted on twitter using the #120trade hashtag.
Be careful out there!
Additional disclosure: long CAT puts, short VXX, long UVXY calls, long AAPL call spread
*Charting notes: FreeStockCharts.com stock prices are not adjusted for dividends. TradingView.com charts for currencies use Tokyo time as the start of the forex trading day. FreeStockCharts.com currency charts are based on Eastern U.S. time to define the trading day.