
AT40 = 31.2% of stocks are trading above their respective 40-day moving averages (DMAs)
AT200 = 39.4% of stocks are trading above their respective 200DMAs
VIX = 22.5
Short-term Trading Call: neutral
Commentary
The market from another planet continues to wobble wildly on its axis. Today was the day for investors to make more withdrawals from sources of funds and retreat from the churn.
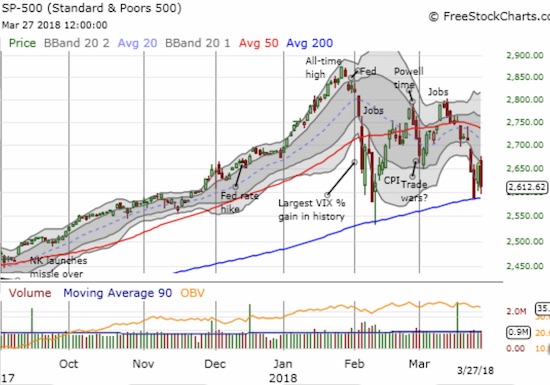
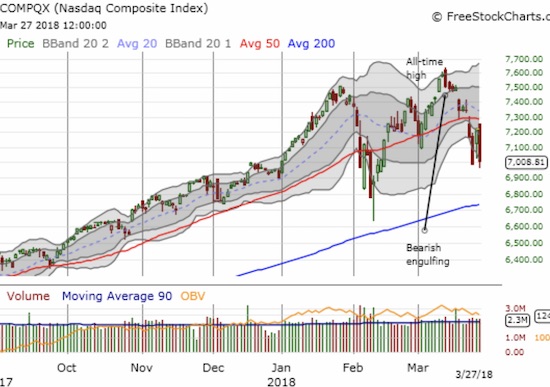
I am surprised that AT40 (T2108), the percentage of stocks trading above their respective 40-day moving averages (DMAs), ended the day as high as it did. My favorite technical indicator closed the day at 31.1%, almost exactly where it opened yesterday. The low of the day did not go much lower. So while the the intraday low of the S&P 500 (SPY) came closer to challenging 200DMA support than yesterday, and the NASDAQ effectively reversed its ENTIRE gain from yesterday, AT40 suggests that enough stocks held sufficient ground to leave open some hope that conditions in the market do not turn entirely bearish. However, this setup is a close call that likely requires some solidly positive (and new) catalyst to lighten the heavy load weighing on the market.
Like AT40, the volatility index, the VIX, did not move as much as I would have expected on such a bearish day. The VIX increased just 7.0% and closed well short of last Friday’s 24.9. Even more interesting is that the volatility products, the iPath S&P 500 VIX ST Futures ETN (VXX) and ProShares Ultra VIX Short-Term Futures (UVXY), DID close roughly even with Friday’s high. The move left me wishing I had taken profits on my VXX short – hindsight is worth a LOT of money.
In addition to VXX, I was left wishing I had taken profits even faster than I originally intended on my SPY call options. They expire next week, so my plan was to ride them at least into Wednesday or Thursday. Now, I have to wonder whether the trades will work at all. My accumulating position in SPY shares is built to ride out the churn, even a revisit to oversold conditions and on to the next rally…whenever (if?) that happens.
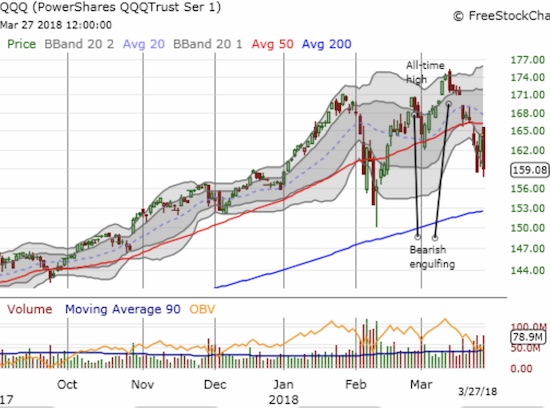
I used today’s selling to buy short-term QQQ call options, April calls on Financial Select Sector SPDR ETF (XLF), and even an April call option for Goldman Sachs (GS). My cup feels full given the sour sentiment in the stock market, so I see no need to accumulate any more bullish positions until/unless AT40 triggers oversold trading conditions. By default, this means in the meantime my eyes are hawking opportunities to short shares and buy puts. I still have most of my hedges on hand as well.
The S&P 500 has survived three consecutive tests of 200DMA support. These successes are starting to look too neat given the short and mid-term bearish signals in the major indices. It is starting to look like the market needs a washout before another sustainable rally appears: a 200DMA breakdown, AT40 oversold (below 20%), and a very large spike in volatility. Such a rush to grasp at the market’s source of funds would help portfolio managers reshape their books for the end-of-quarter show and set up a fresh wave of buying to start the second quarter. That is the new optimistic scenario anyway!
CHART REVIEWS
There are a LOT of telling charts out there. With manic churn in the market, a snapshot is more ephemeral than ever. Having said that, I HAVE to post an update to one chart and post a similarly damaging chart from a market leader. They both demonstrate what a rush to withdraw from a source of funds looks like.
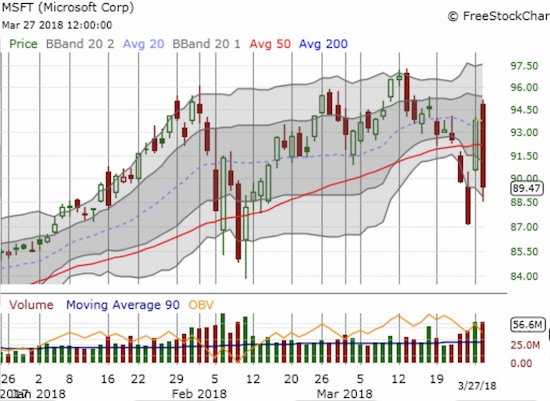
Microsoft (MSFT)
Just one day after an incredible move, MSFT succumbed to wicked selling. MSFT lost 4.6%, filled Monday’s gap, and sliced through its 50DMA again. Talk about manic behavior! In response to the 50DMA breakout, I concluded that MSFT was primed for buying the dip. Today, the stock instantly disqualified itself with this breakdown. That trillion dollar mark Morgan Stanley is targeting will have to wait another day longer…
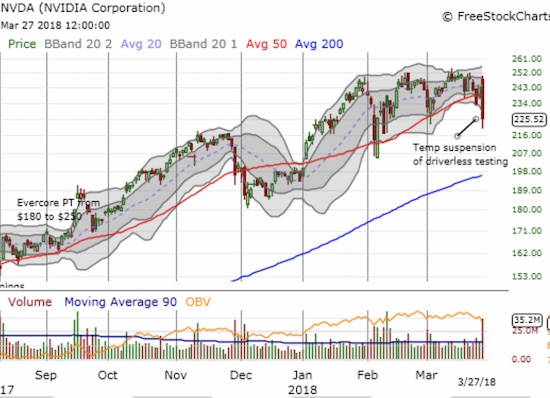
Nvidia (NVDA)
Nothing hurts sentiment like watching the market’s leaders get shoved off lofty heights. NVDA did MSFT one better by adding a new 7-week closing low to a bearish engulfing pattern and a 50DMA breakdown. The company was compelled to temporarily suspend its testing of self-driving cars on public roads in an effort to learn from Uber’s fatal accident in Arizona. This decision will hang over the stock until investors get some clues about the investigation’s progress. Until then 47 P/E, 14 price/sales, and 18 price/book ratios may look mightily expensive relative to the new risk and the toppy technicals.
Other trades related to previous posts: N/A
— – —
FOLLOW Dr. Duru’s commentary on financial markets via email, StockTwits, Twitter, and even Instagram!
“Above the 40” uses the percentage of stocks trading above their respective 40-day moving averages (DMAs) to assess the technical health of the stock market and to identify extremes in market sentiment that are likely to reverse. Abbreviated as AT40, Above the 40 is an alternative label for “T2108” which was created by Worden. Learn more about T2108 on my T2108 Resource Page. AT200, or T2107, measures the percentage of stocks trading above their respective 200DMAs.
Active AT40 (T2108) periods: Day #28 over 20%, Day #2 over 30% (overperiod), Day #4 under 40% (underperiod), Day #11 under 50%, Day #36 under 60%, Day #42 under 70%
Daily AT40 (T2108)
")
Black line: AT40 (T2108) (% measured on the right)
Red line: Overbought threshold (70%); Blue line: Oversold threshold (20%)
Weekly AT40 (T2108)

*All charts created using freestockcharts.com unless otherwise stated
The charts above are my LATEST updates independent of the date of this given AT40 post. For my latest AT40 post click here.
Related links:
The AT40 (T2108) Resource Page
You can follow real-time T2108 commentary on twitter using the #T2108 or #AT40 hashtags. T2108-related trades and other trades are occasionally posted on twitter using the #120trade hashtag.
Be careful out there!
Additional disclosure: long SPY shares and calls, short VXX, long QQQ calls
*Charting notes: FreeStockCharts.com uses midnight U.S. Eastern time as the close for currencies. Stock prices are not adjusted for dividends.
Duru,
CDs are yielding as much or more as the dividend yield on SPDRs. The FED has already announced more increases are coming, too. Not good for the market.
No risk in CDs.
And as long as the VIX stays above 20, there’s not much chance of significant upward movement for this market.
On the other hand, as you pointed out, a huge selldown and T2108 spike to single digits could set up a nice buying opportunity….
We’ll see…..
This is quite a juncture! I am sitting on my hands more and more, waiting for the “big” sign…