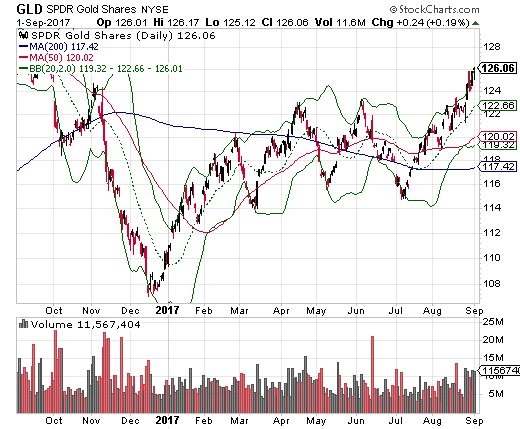
The SPDR Gold Trust (GLD) accomplished a major milestone in the past week: it fully reversed its entire post-election loss in what looks like a major breakout.

Source: StockCharts.com
Speculators have been rushing back to gold likely in anticipation of these much higher prices.

Source: Oanda’s CFTC’s Commitments of Traders
Since 2008, here are the years where a similar rise from a July trough or significant dip have occurred: 2010 (to an October peak), 2012 (to an October peak), 2013 (to an October peak), and 2015 (to an October peak). A seasonal pattern “almost” exists here. While we cannot expect every year to bring a swing from a July dip to an October peak, it sure appears that when speculators buy off a July low, the accumulation continues until October. In other words, I fully expect this bullish run to last until at least October. I also do not think it is an accident that the peak occurs just as the seasonally weak period for stocks comes to an end.
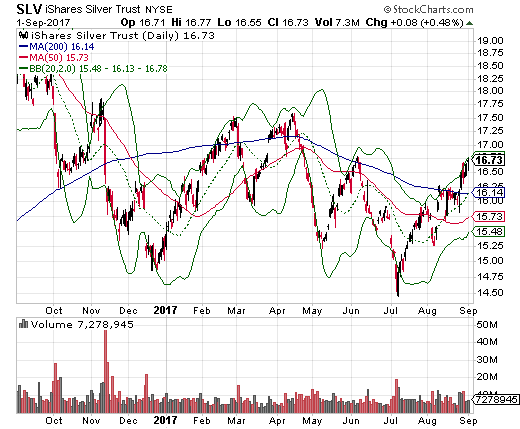
The iShares Silver Trust (SLV) is also enjoying a rebound from a July trough. SLV even managed to break out above resistance at its 200-day moving average (DMA). I sold my last tranche of SLV call options at the 200DMA test. However, SLV has quite a ways to go until it pulls off the same post-election milestone as GLD. Still, I dove right back into some SLV call options expiring in September (to be refreshed with an October expiration if needed) to play the breakout.

Source: StockCharts.com
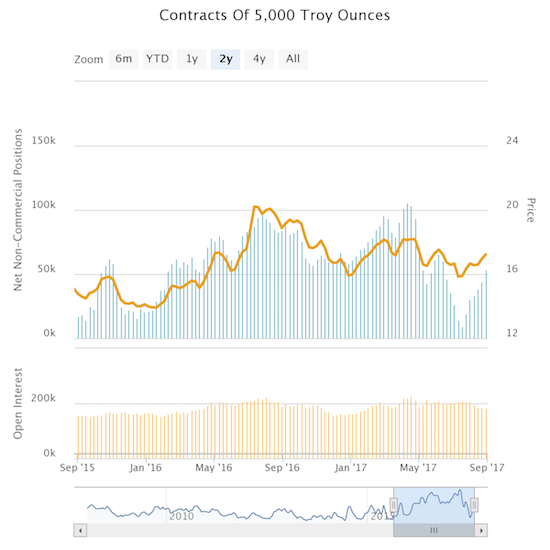
Like gold speculators, silver speculators have steadily re-accumulated net long contracts form the July low. Yet the current positioning has only returned to levels last seen in June. Presumably there is a LOT more upside to go here.

Source: Oanda’s CFTC’s Commitments of Traders
Since 2008, here are the years where a similar rise from a July trough or significant dip have occurred: 2009 (to an October peak), 2010 (to an October peak), 2011 (to a September peak), 2012 (to an October/December double peak), 2013 (to a September/October double peak), and 2015 (to a November peak). Clearly, the pattern in silver accumulation differs from gold in both timing and consistency. Yet, the July trough/dip is more prevalent in silver by two extra years. So presumably a run-up that lasts into this month and as late as November is in the cards.
Relying on historical patterns is always a play on conditional probabilities. Having fundamental drivers to support the pattern solidifies the risk/reward. In the current case, not only is there the typical seasonal weakness in stocks somewhere from August to October, but also there are geo-political and fiscal risks. North Korea apparently just conducted its sixth nuclear test in yet another act that probes and prods U.S. President Donald Trump’s threats of retaliation for further provocations. The U.S. government is also staring down a fight over the debt ceiling. The U.S.’s near masochistic and uniquely self-inflicted ritual of authorizing increases in the government’s spending authority would have likely sailed to passage with little notice if not for President Trump’s threats to shut down the government over funding for his wall on the border with Mexico. The threats could be a political ploy to pin the blame on Congress for a lack of funding, but the path to the final bluff could cause some angst in financial markets.
In other words, I have plenty of reasons to expect gold and silver speculators to continue accumulating long contracts in sufficient number to help push gold and silver prices, and by extension GLD and SLV, to higher ground in the next few weeks or months.
Be careful out there!
Full disclosure;
