AT40 = 48.2% of stocks are trading above their respective 40-day moving averages (DMAs)
AT200 = 55.6% of stocks are trading above their respective 200DMAs
VIX = 10.7 (volatility index)
Short-term Trading Call: cautiously bullish (downgrade from bullish)
Commentary
Time to downgrade my bullishness to “cautiously bullish.”
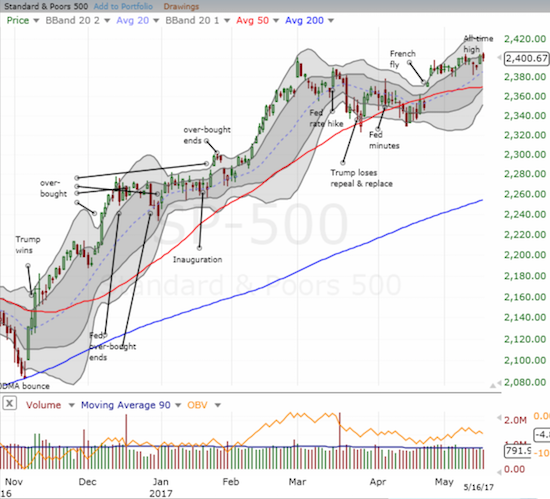
While the S&P 500 (SPY) made a new (marginal) all-time high on Monday and fell back Tuesday just ever so slightly, the surrounding context for the market is deteriorating again. AT40 (T2108), the percentage of stocks trading above their respective 40-day moving averages (DMAs), closed at 48.2%. These levels are surprisingly low given the S&P 500’s new records but at least my favorite technical indicator has more or less stabilized over the past two weeks. More concerning is AT200 (T2107), the percentage of stocks trading above their respective 200DMAs. AT200 closed at 55.6%, a new 6-month low. The intraday low was also a new 6-month low. In other words, while the S&P 500 tentatively stretches higher, the mass of stocks are collectively providing a drag.
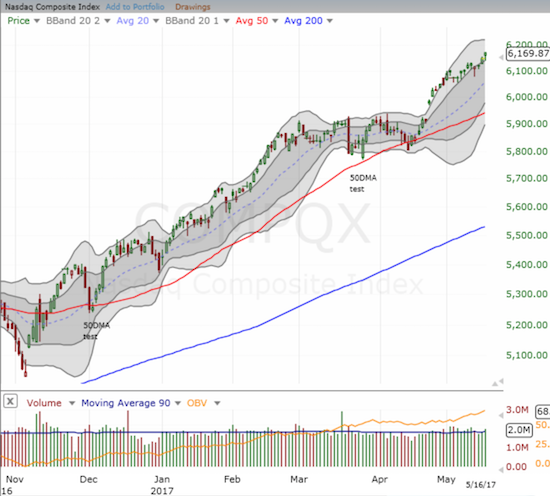
The NASDAQ (QQQ)* is also making new all-time highs but in a much more convincing way. The tech-laden index is in an uptrend with persistent momentum and printed a new all-time high that left the S&P 500 behind again.
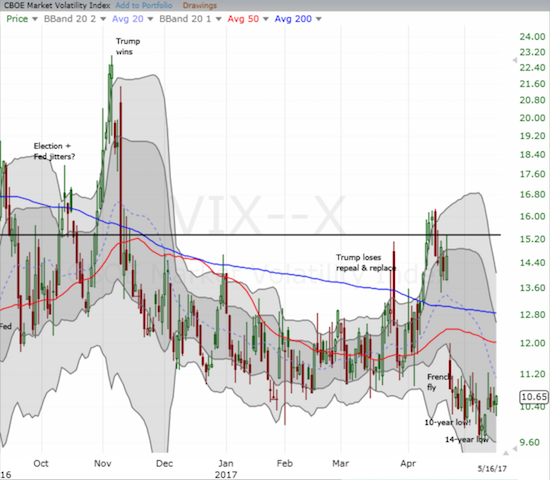
Since the “French Fly,” the volatility index has traded below 11.3 and closed most days below 11, qualifying for a period of extremely low volatility. As a reminder, the surprising implication of such a period is that it represents bullish prospects for the stock market and NOT bearish ones.
Taken together, I have reasons to stay bullish but every reason to back off into a cautious posture. A convincing breakout for the S&P 500 would motivate me to relax again. However, the breakdown of the U.S. dollar (DXY0) has emerged on my radar as a potential catalyst for shaking the market out of its blissful slumber.
Insider stock purchases can provide reassurances. There are two such cases that have caught my close attention: Twilio (TWLO) and Twitter (TWTR).
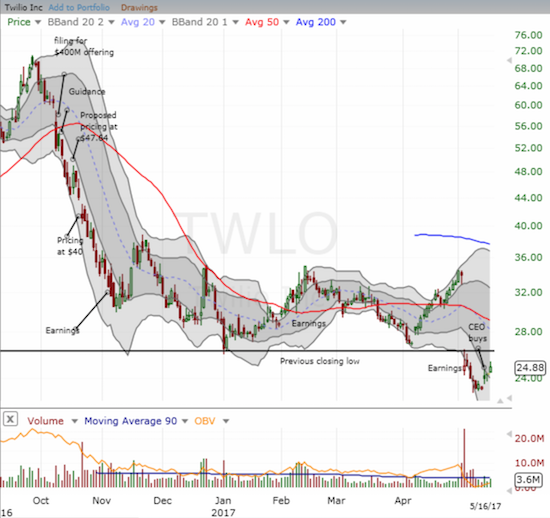
I wrote about TWLO two weeks ago to describe how its latest post-earnings implosion confirmed my earlier warnings about the stock. In response to a Jim Cramer interview of the CEO, I suggested only buying the stock after it managed to print a new post-earnings high. A different trigger has appeared in the form of a major CEO purchase of shares. The stock gapped up in response but clearly showed the lingering effect of burned traders and investors. Two days later, TWLO finally confirmed the potential bullish implications of the CEO purchase with a close higher than the high of the day the news broke. I am now long TWLO call options.
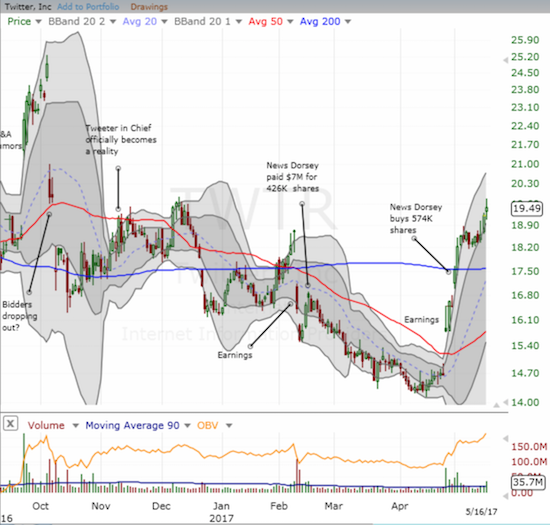
I wrote about TWTR as a twist on a Trump Trade. TWTR proceeded to sell off from there and has only just now surpassed its price at the time of my post. In between, I was stubborn enough to buy shares and sell put options (now closed out). More importantly, co-founder and CEO of Twitter Jack Dorsey loaded up on TWTR shares TWICE. The market completely ignored the first purchase. The second time may have been the charm. The news came on the heels of an earnings report that actually garnered a positive response (a gap up even). Fortunes may FINALLY be turning around for TWTR…
Be careful out there!
— – —
FOLLOW Dr. Duru’s commentary on financial markets via email, StockTwits, Twitter, and even Instagram!
“Above the 40” uses the percentage of stocks trading above their respective 40-day moving averages (DMAs) to assess the technical health of the stock market and to identify extremes in market sentiment that are likely to reverse. Abbreviated as AT40, Above the 40 is an alternative label for “T2108” which was created by Worden. Learn more about T2108 on my T2108 Resource Page. AT200, or T2107, measures the percentage of stocks trading above their respective 200DMAs.
Active AT40 (T2108) periods: Day #311 over 20%, Day #131 over 30%, Day #21 over 40% (overperiod), Day #1 under 50% (underperiod, ending 1 day over 50%), Day #13 under 60%, Day #83 under 70%
Daily AT40 (T2108)

Black line: AT40 (T2108) (% measured on the right)
Red line: Overbought threshold (70%); Blue line: Oversold threshold (20%)
Weekly AT40 (T2108)

*All charts created using freestockcharts.com unless otherwise stated
The charts above are my LATEST updates independent of the date of this given AT40 post. For my latest AT40 post click here.
Related links:
The T2108 Resource Page
You can follow real-time T2108 commentary on twitter using the #T2108 or #AT40 hashtags. T2108-related trades and other trades are occasionally posted on twitter using the #120trade hashtag.
Be careful out there!
Full disclosure: long UVXY call options, long TWTR, long TWLO call options
*Note QQQ is used as a proxy for a NASDAQ-related ETF
