
AT40 = 53.0% of stocks are trading above their respective 40-day moving averages (DMAs)
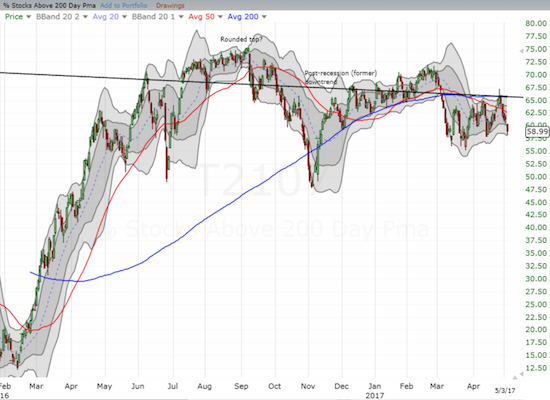
AT200 = 59.0% of stocks are trading above their respective 200DMAs
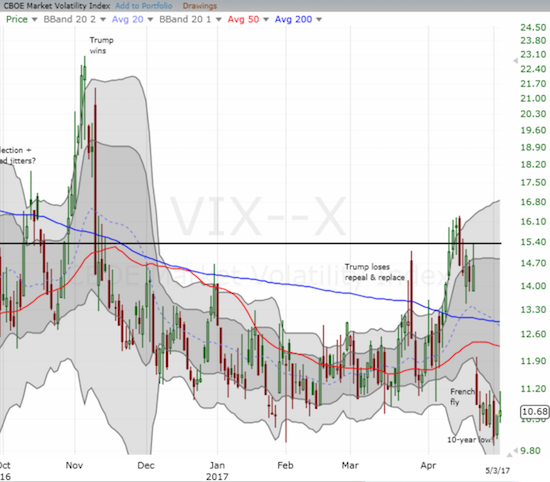
VIX = 10.7 (volatility index)
Short-term Trading Call: bullish
Commentary
The Federal Reserve effectively reaffirmed its commitment to two more rate hikes this year. The S&P 500 (SPY) yawned, but trouble deepened elsewhere in the market. AT40 (T2108), the percentage of stocks trading above their respective 40-day moving averages (DMAs), dropped from 58.3% to 53.0%. Even worse, AT200 (T2107), the percentage of stocks trading above their respective 200DMAs, retested the April low before rebounding a bit to close at 59.0%.
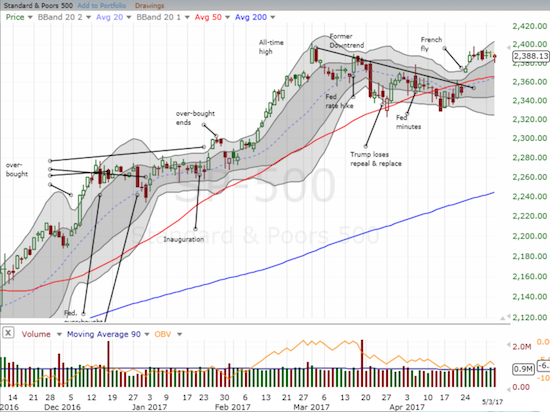

As I indicated in a previous post, typically a fade like AT40’s away from the overbought threshold would flip me bearish. However, this time I decided to hold onto my bullish trading call because I see no convincing signs that sellers are summoning renewed strength. Only a break of 50DMA support for the S&P 500 will force me to reconsider.
The main source of trouble on Wednesday came again from the mid and small caps. SPDR S&P MidCap 400 ETF (MDY) dropped a fraction of a percent and retested 50DMA support at its low of the day. The iShares Russell 2000 (IWM) lost a fraction more than MDY but its low did not quite qualify for a 50DMA test. The Financial Select Sector SPDR® ETF (XLF) printed a solid GAIN of 0.8% yet came just short of recapturing the February breakout line.
The volatility index, the VIX, showed little signs of renewed concern. The VIX faded from its highs and gained a little less than 1%. It remains at an extremely low level and just off making a 10-year low.
Again, the conditions seem ripe for the S&P 500 to retest its 50DMA support before it moves higher. Of course, such a pullback would not represent a major bout of selling form current levels.
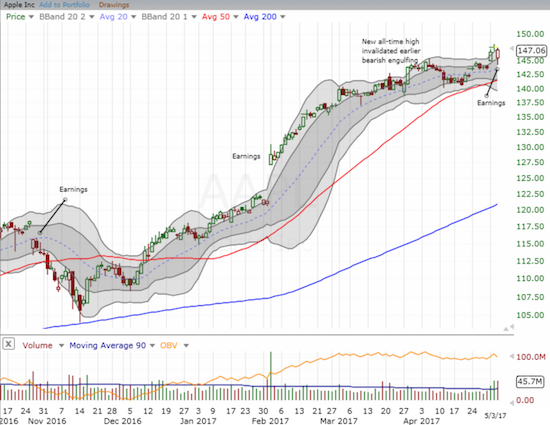
The star of the day was of course Apple (AAPL). The stock gapped down almost 2% post-earnings and rallied from there. The stock ALMOST closed the entire gap. Note that the remaining pattern is close to an abandoned baby top. If this were any other stock, I would be bold enough to declare “close enough.”
AAPL has had a monster move and the persistence of buyers has shown up along the entire up-trend. On May 2, Nightly Business Report shed some light on the power of institutional buying in AAPL. NBR interviewed Nancy Tengler, chief investment officer at Heartland Financial. Here is what she had to say about her company’s algorithm for investing in AAPL (emphasis mine):
“…as portfolio managers, we have to follow certain guidelines, right? So, the stock had gotten to about 6 percent of our portfolio. And we recently sold it back to 4.5 or 5 percent, depending on the strategy.
If the stock sells off more than 2 percent, which is where it was when I looked last, we`ll be back in picking away at it to round our holdings back up, and then hold on again for the next move. But it`s not going to take off in the next few months. So, I think investors have time to accumulate at lower prices, and then hold on for the next three to five-year period, because this company is doing a lot of things right. And there`s a lot of skeptics.
And so, when the skeptics — you know, at $89, when I was recommending it, I took a huge beating, and I`m certainly glad. I wished I had bought more.”
And THAT is one good explanation for how a stock can drive higher and higher with barely a blip.
Be careful out there!
— – —
FOLLOW Dr. Duru’s commentary on financial markets via email, StockTwits, Twitter, and even Instagram!
“Above the 40” uses the percentage of stocks trading above their respective 40-day moving averages (DMAs) to assess the technical health of the stock market and to identify extremes in market sentiment that are likely to reverse. Abbreviated as AT40, Above the 40 is an alternative label for “T2108” which was created by Worden. Learn more about T2108 on my T2108 Resource Page. AT200, or T2107, measures the percentage of stocks trading above their respective 200DMAs.
Active AT40 (T2108) periods: Day #302 over 20%, Day #122 over 30%, Day #12 over 40%, Day #9 over 50% (overperiod), Day #4 under 60% (underperiod), Day #74 under 70%
Daily AT40 (T2108)
")
Black line: AT40 (T2108) (% measured on the right)
Red line: Overbought threshold (70%); Blue line: Oversold threshold (20%)
Weekly AT40 (T2108)

*All charts created using freestockcharts.com unless otherwise stated
The charts above are my LATEST updates independent of the date of this given AT40 post. For my latest AT40 post click here.
Related links:
The T2108 Resource Page
You can follow real-time T2108 commentary on twitter using the #T2108 or #AT40 hashtags. T2108-related trades and other trades are occasionally posted on twitter using the #120trade hashtag.
Be careful out there!
Full disclosure: long UVXY call options
*Note QQQ is used as a proxy for a NASDAQ-related ETF