AT40 = 53.3% of stocks are trading above their respective 40-day moving averages (DMAs)
AT200 = 61.1% of stocks are trading above their respective 200DMAs
VIX = 14.6 (volatility index)
Short-term Trading Call: cautiously bullish)
Commentary
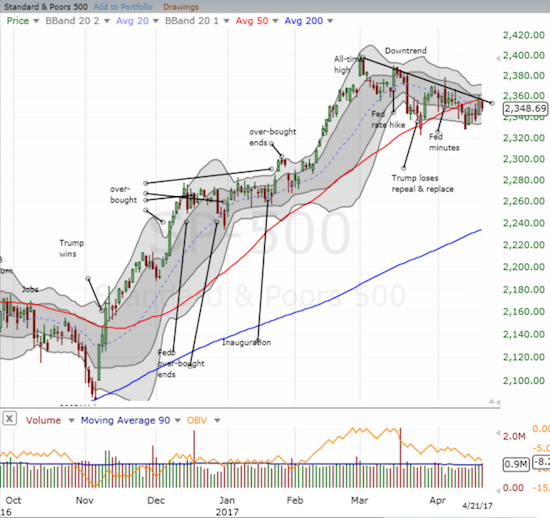
In the middle of last week, the S&P 500 (SPY) looked firmly locked in a state of stasis. The very next day, the index rallied right through resistance at its 50-day moving average (DMA) before closing directly beneath it. While sellers returned to close out the week, the pattern of higher lows continued even as the downtrend from all-time highs held as resistance. (Note that I redrew the downtrend one more time to align with the daily closes – the method recommended by Trader Vic in “Methods of a Wall Street Master”).

Like the S&P 500, AT40 (T2108), the percentage of stocks trading above their respective 40DMAs, is knocking on the door. My favorite technical indicator closed the week at 53.3%. The previous day it closed 55.9% and set a marginally higher bar for the current trading range.
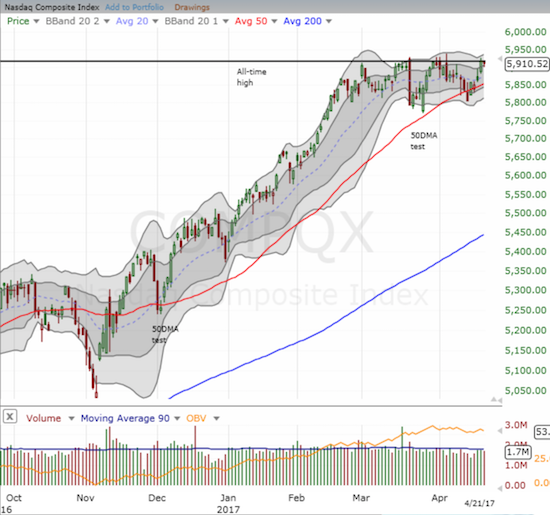
The NASDAQ (QQQ)* is also knocking on the door. On Thursday, the tech-laden index made a new (very) marginal all-time high. The small slide on Friday leaves the appearance that the NASDAQ is finally ready to make a new major breakout.

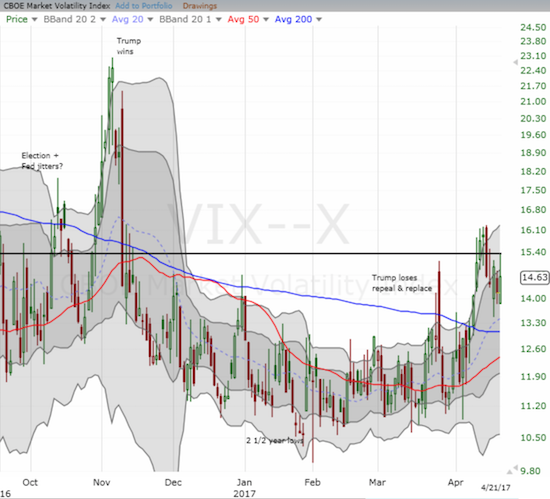
While the stock market knocks on the door, the volatility index, the VIX, pivots. On Friday, the VIX once again demonstrated the significance of the 15.35 pivot. The VIX reached as high as 15.33 before fading back to a 14.6 close. Perhaps the volatility index is elevated because of looming geo-political risks. If so, the door-knocking by the major indices becomes all the more impressive.

In trading, my call options on ProShares Ultra S&P500 (SSO) expired harmless. The upward momentum on the S&P 500 stalled out after the trade and then did not recover fast enough. I will lay off the options on SSO until earnings season is more in the rear view mirror.
— – —
FOLLOW Dr. Duru’s commentary on financial markets via email, StockTwits, Twitter, and even Instagram!
“Above the 40” uses the percentage of stocks trading above their respective 40-day moving averages (DMAs) to assess the technical health of the stock market and to identify extremes in market sentiment that are likely to reverse. Abbreviated as AT40, Above the 40 is an alternative label for “T2108” which was created by Worden. Learn more about T2108 on my T2108 Resource Page. AT200, or T2107, measures the percentage of stocks trading above their respective 200DMAs.
Active AT40 (T2108) periods: Day #295 over 20%, Day #115 over 30%, Day #5 over 40%, Day #2 over 50% (overperiod), Day #36 under 60% (underperiod), Day #67 under 70%
Daily AT40 (T2108)

Black line: AT40 (T2108) (% measured on the right)
Red line: Overbought threshold (70%); Blue line: Oversold threshold (20%)
Weekly AT40 (T2108)

*All charts created using freestockcharts.com unless otherwise stated
The charts above are my LATEST updates independent of the date of this given AT40 post. For my latest AT40 post click here.
Related links:
The T2108 Resource Page
You can follow real-time T2108 commentary on twitter using the #T2108 or #AT40 hashtags. T2108-related trades and other trades are occasionally posted on twitter using the #120trade hashtag.
Be careful out there!
Full disclosure: long SSO shares, long UVXY puts
*Note QQQ is used as a proxy for a NASDAQ-related ETF
