
The last Housing Market Review covered data reported in December for November, 2016. At that time, the iShares US Home Construction (ITB) had cracked through support at its 200-day moving average (DMA) as part of a post Fed rate hike pullback. That close turned out to be the last bottom for ITB, and it set up some profitable homebuilder trades. Fed fears are almost a distant memory now as a lot more focus returns to economic optimism. Even a Presidential executive order that will dampen future housing demand failed to discourage the market (as expected).
The latest round of housing data generally represent small pullbacks/declines in the middle of strong trends. The annual data remind us that housing set new post-recession highs. Indeed, trading action in ITB mainly ignored the latest macro data in favor of earnings news and the larger trends. Several builders resonated with the optimism in the stock market and set up strong expectations for the Spring selling season. I see the confidence of a coiled spring…but I am still hoping for one more pullback ahead of the Spring selling season to facilitate my desired positioning.
New Residential Construction (Housing Starts) – December, 2016
The downward revisions for housing starts continued. After four straight months of downward revisions, housing starts for single-family homes received two upward revisions in a row (September and October). The last two months have received downward revisions. December starts fell 4.0% month-over-month but increased 3.9% year-over-year to 795,000. Despite the second monthly pullback in a row, the overall post-recession uptrend remains intact. On an annual basis, single-family housing starts increased 9.3%. Starts remain well below pre-recession standards.
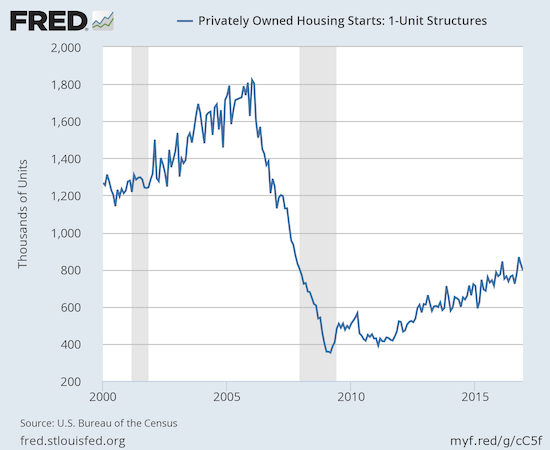
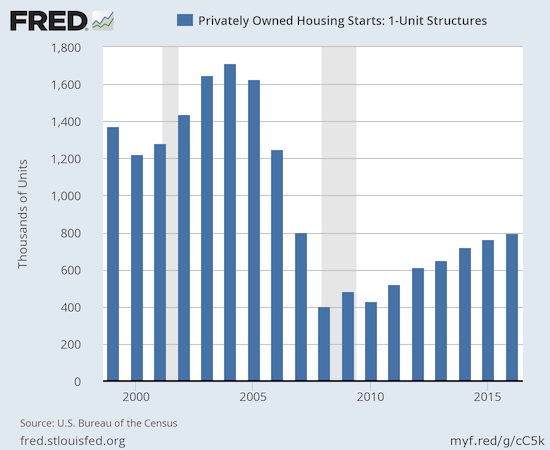
Source: US. Bureau of the Census, Privately Owned Housing Starts: 1-Unit Structures [HOUST1F], retrieved from FRED, Federal Reserve Bank of St. Louis, February 5, 2017.
Starts were VERY mixed year-over-year across the regions: the Midwest and the West jumped 13.4% and 13.5% respectively. The Northeast and the South were the other bookends with 1.6% and 1.7% declines respectively. I do not mind the mixed performance since overall it confirms the good health of the housing market.
Existing Home Sales – December, 2016
September put existing home sales back on solid footing, and October delivered validating follow-through. November took existing home sales to a new post-recession high. December ended the transformation of the National Association of Realtors (NAR) from wariness to optimism as the constraints binding sales regained the headlines.
“Solid job creation throughout 2016 and exceptionally low mortgage rates translated into a good year for the housing market…However, higher mortgage rates and home prices combined with record low inventory levels stunted sales in much of the country in December…
While a lack of listings and fast rising home prices was a headwind all year, the surge in rates since early November ultimately caught some prospective buyers off guard and dimmed their appetite or ability to buy a home as 2016 came to an end.”
The seasonally adjusted annualized sales of 5.49M were down 2.8% month-over-month from a upwardly revised 5.65M in sales for November (previously 5.61M). Year-over-year sales only increased 0.7% (compare to November’s 15.4% year-over-year pop). On an annual basis, 2016 ended with 5.45M, a small increase from 2015’s 5.25M. The NAR reported that sales have not been higher since 2006’s 6.48M in existing home sales.

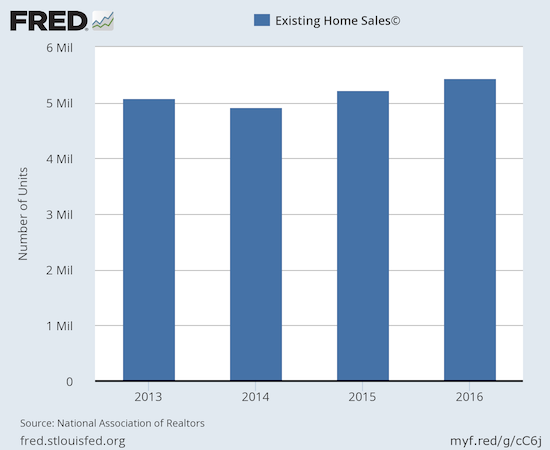
(recall that the NAR no longer makes data available before 2013. For more historical data to 1999 click here)
Source: National Association of Realtors, Existing Home Sales© [EXHOSLUSM495S], retrieved from FRED, Federal Reserve Bank of St. Louis, February 6, 2016.
Once again, these sales results occurred under the shadow of the on-going trends of shrinking inventory and rising median prices. The NAR complained earlier this year about these factors as impediments to the market. In the November Housing Market Review, I marveled that the NAR explained strong sales as the release of pent-up demand from tight inventory. I wondered instead whether anticipation of higher mortgage rates played a role. In December, the NAR pulled the rate card, and I am not surprised to see mortgage rates loom in the NAR story in the immediate wake of a Fed rate hike.
I continue to believe the data demonstrate underlying fundamental strength in demand even as inventory, price, and now rate headwinds loom. Rising prices and tightening inventory are symptoms of strong demand and housing starts are still lagging previous recovery cycles. First-time home buyers are hanging in there at 32% of sales, the same as November.
In August, inventory cratered 10.1% year-over-year. In September it dropped 6.8% year-over-year. In October, inventory declined 4.3%. In November, inventory plunged 9.3% year-over-year to 2.04M homes. The trend continued in December with a 6.3% year-over-year drop and the lowest absolute amount of inventory since NAR began tracking in 1999. The 19-month year-over-year decline in inventory has driven supply to 3.6 months of sales. Inventory has declined year-over-year for 18 straight months. The market for existing homes is severely out of balance.
Investors suddenly rose to 15% of sales. In October that share dropped from 14% to 13% which was the same share in August. In November, investor share of sales dropped to 12%. The share was 11% in July. As context, recall July’s share was the lowest share since 9% in July, 2009. In February, investors bought 18% of existing homes which was the highest share since April, 2014.
In May and June, the West was the only region in the country to experience year-over-year drops in existing home sales. In July, every region suffered year-over-year declines. In August, no region experienced a year-over-year decline. In September, the South was the only region to experience a year-over-year decline. For October, sales were so strong that every region experienced year-over-year gains. November’s strong sales also produced broad and impressive regional strength. Finally, despite the month-over-month declines in each region excluding the South (which was flat), all regions experienced year-over-year gains from 3.8% to 6.5%.
December’s 4.0% year-over-year increase in the median price of an existing home represents the 58th consecutive month of year-over-year increases. The median price of $232,200 is a small decline from November’s $234,900 and is also below the all-time record of $247,700 set in June. So much for the potential price deceleration that seemed to loom last summer.
Single-family home sales fared better than overall existing sales. Single-family sales declined on a monthly basis (1.8%) and increased on a yearly basis by 1.5%. This small gain was a significant slowing from November’s 16.2% year-over-year surge. The median price of $233,500 dropped below November’s $236,500, flat with October’s $233,700, and increased 3.8% year-over-year.
“Single-family home sales declined 1.8 percent to a seasonally adjusted annual rate of 4.88 million in December from 4.97 million in November, but are still 1.5 percent above the 4.81 million pace a year ago. The median existing single-family home price was $233,500 in December, up 3.8 percent from December 2015.”
{video added February 23, 2017}
New Residential Sales – December, 2016
New home sales were the big headline in August as July sales soared to a fresh post-recession high. I predicted that post-recession peak would not get challenged until the next Spring selling season. That assessment remains well intact as December new home sales met a wall.
New single-family home sales hit 536,000 for December, a marked decrease from November’s 598,000 (revised up from 592,000). This was a 10.4% month-over-month decline and a 0.4% year-over-year decline. December brings an end to a torrid streak of yearly gains: November increased 17.7%, October was up 17.8%, September was up 24.9% year-over-year, August was up 10.7% year-over-year, July was up 24.9% year-over-year, and June was up 18.2% year-over-year.
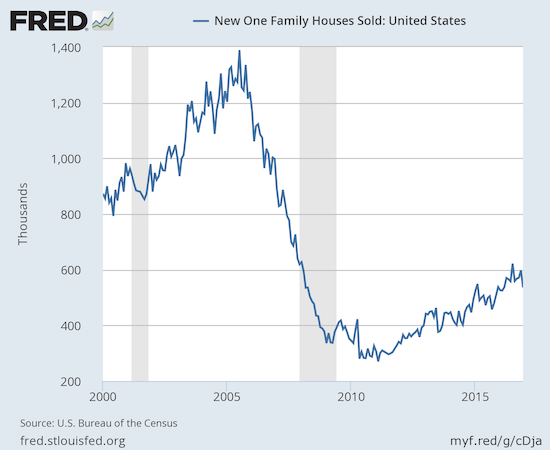
Source: US. Bureau of the Census, New One Family Houses Sold: United States [HSN1F], retrieved from FRED, Federal Reserve Bank of St. Louis, February 7, 2017.
New home inventory jumped from 5.1 months of supply to 5.8. This level sits in (surprisingly) sharp contrast with the much more scarce inventory of existing homes.
New home sales exhibited a large range of year-over-year changes across regions. The Northeast soared 48.4% while the Midwest reeled with a 29.0% drop. The Southeast remained flat. The West eked out a 2.0% gain.
Home Builder Confidence: The Housing Market Index– January, 2017
In the last Housing Market Review, the Housing Market Index (HMI) was the most impressive data point of the report. The parallel surge in confidence that ended 2016 cooled off ever so slightly in January but remained strong overall.
The Housing Market Index (HMI) started 2017 at 67 – a 2-point drop from December’s downwardly revised 69. Excluding December, the HMI was last this high in October, 2005. The housing market will launch into the Spring selling season with sentiment at an exceptionally strong level. As I noted in the last Review, I do not expect confidence to get much higher than December’s level because sentiment was last this high at the height of the last housing bubble. Going forward, I will be on watch for any signs that this peak in confidence is giving way to a decline. I only expect near-term weakening if the Spring selling cycle somehow fails to deliver.
The National Association of Home Builders (NAHB) implied in November that the HMI might drop in the wake of the election. In December, the NAHB gave credit to the election for a surge in the HMI. For January, the NAHB referred back to December’s observations:
“The HMI rose sharply in December as the election results raised hopes among builders that a new Congress and administration will help create a better business climate for small businesses, particularly with respect to improving regulatory costs, which increased more than 29% over the last five years.”
All three components of the HMI dropped slightly. Consumer sentiment increased by a fraction of a point.
Click for a larger view…
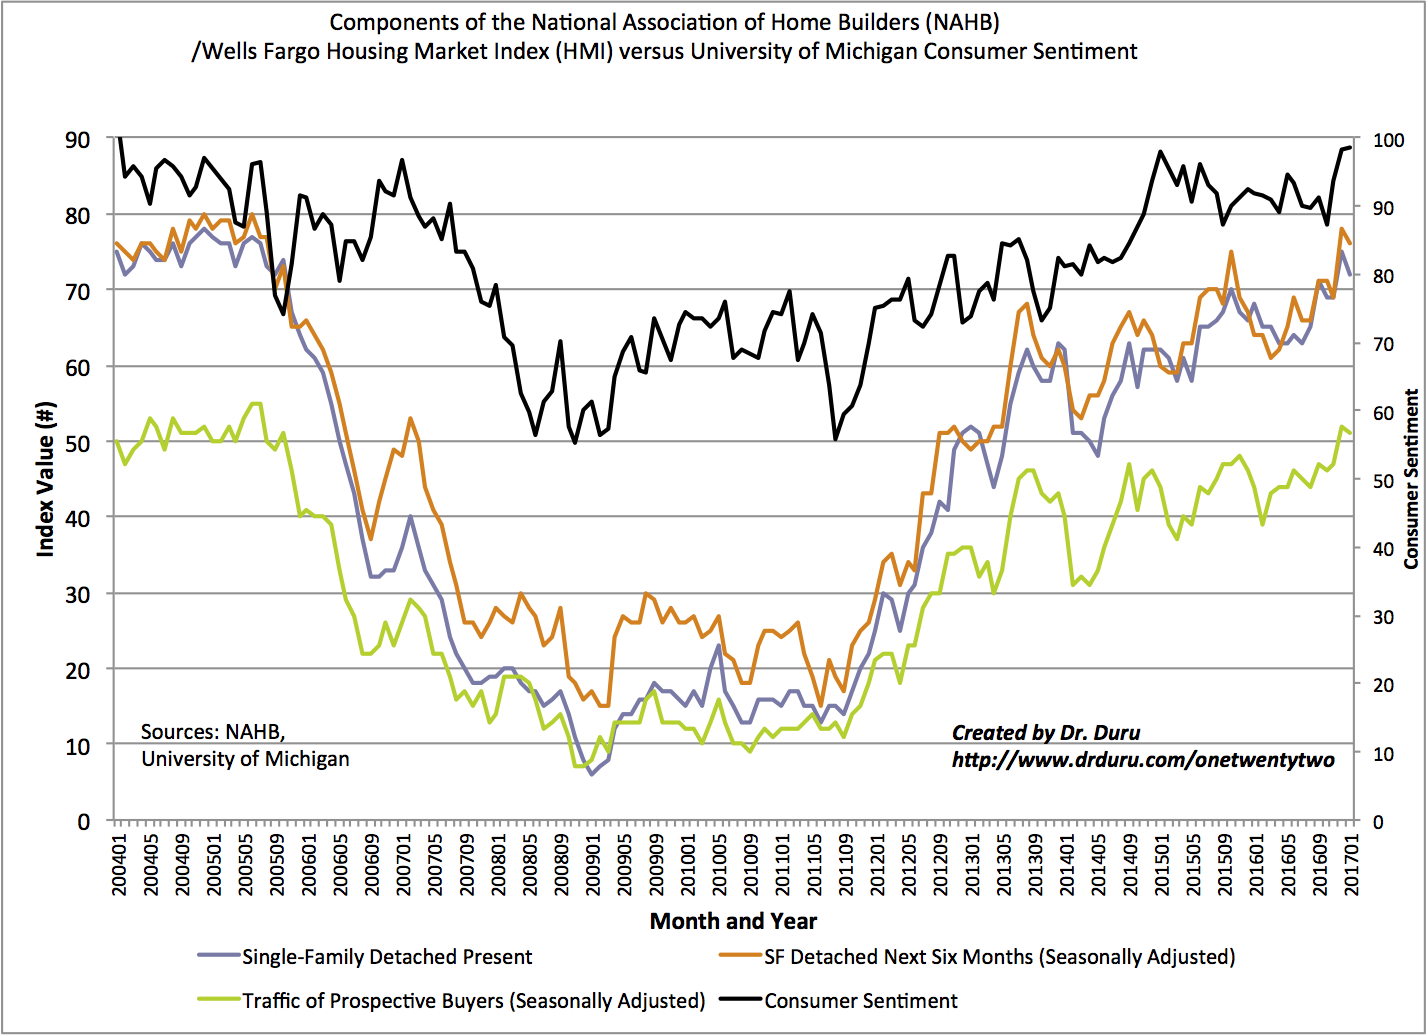
The regional changes in HMI were very mixed. The West was the most notable as it plunged from 86 to 75. December now looks like a large anomaly given November was at 76 for the West. More “normal” readings in the West by themselves should keep overall HMI capped. The Midwest stayed flat at 66. The South dropped from 70 to 67, and the Northeast fell from 57 to 52.
Parting thoughts
In the last Review, I favored Meritage Homes (MTH) over Century Communities (CCS) as the next trading idea. Since then, MTH reported earnings that disappointed the market, and the stock now trades below its 50 and 200-day moving averages (DMAs). CCS reported preliminary results that catapulted the stock to an all-time high. CCS reports full earnings on February 14th, and I am still waiting for that news before deciding on my next move in that stock.
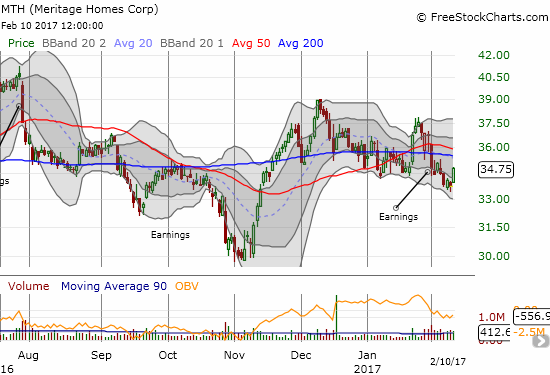
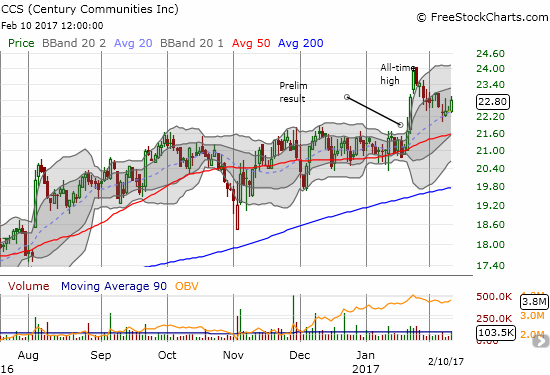
Source for charts: FreeStockCharts.com
I was hoping for a deeper pullback in iShares US Home Construction (ITB) to set up my next housing trade to ride through the rest of the seasonally strong period for home builders (through March or April). In fact, I planned to be fully positioned for that ride. However, with the stock market making new all-time highs and seemingly preparing for a fresh rally, ITB has followed suit with a neat rebound off its 20DMA uptrend. The fade following earnings from Pulte Homes (PHM) seemed to mark a top and now serves as the ultimate barrier. If this high breaks before I can position new trades, I may just sit out the rally for a while. From a trading perspective I am wary for 2 reasons: 1) volatility in the stock market is dangerously low, and 2) volume on ITB has dried up for February and suggests a lack of buying conviction.
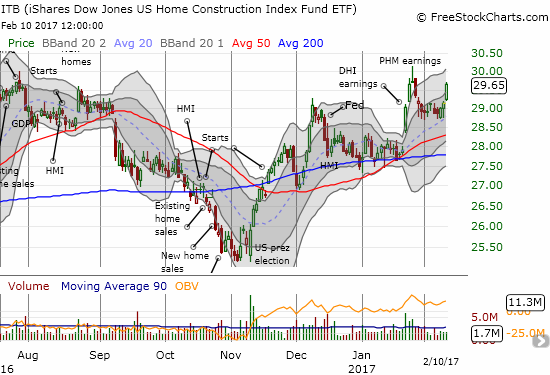
Source: FreeStockCharts.com
Stay tuned for additional trade ideas as the housing sector will likely experience extra volatility from all sides in the coming months: political, economic, fiscal, and monetary.
Be careful out there!
Full disclosure: no positions