
(T2108 measures the percentage of stocks trading above their respective 40-day moving averages [DMAs]. It helps to identify extremes in market sentiment that are likely to reverse. To learn more about it, see my T2108 Resource Page. You can follow real-time T2108 commentary on twitter using the #T2108 hashtag. T2108-related trades and other trades are occasionally posted on twitter using the #120trade hashtag. T2107 measures the percentage of stocks trading above their respective 200DMAs)
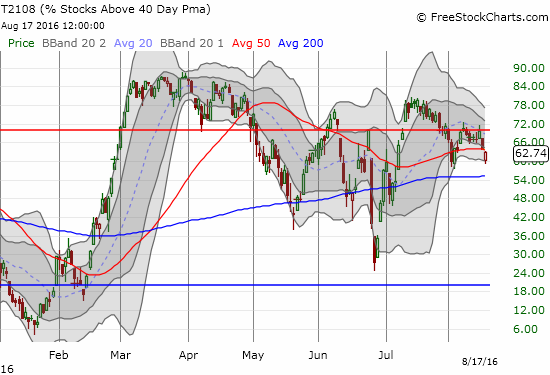
T2108 Status: 62.7% (59.0% at the low)
T2107 Status: 71.7%
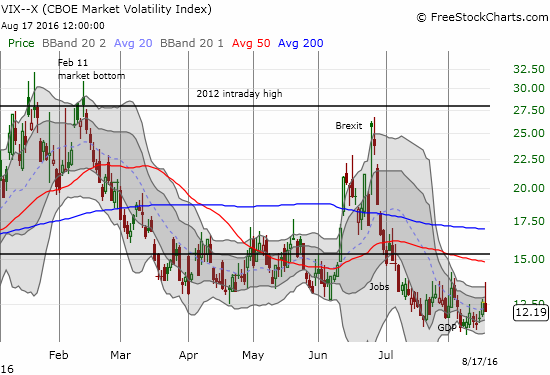
VIX Status: 12.2 (as high as 13.7)
General (Short-term) Trading Call: neutral
Active T2108 periods: Day #127 over 20%, Day #33 over 30%, Day #32 over 40%, Day #31 over 50%, Day #8 over 60% (overperiod), Day #10 under 70%
Commentary
%stocks>40DMA ~ 60%. This is the second pullback from overbought threshold (70%) in August. Conditions looking bearish again. #T2108 $SPY
— Dr. Duru (@DrDuru) August 17, 2016
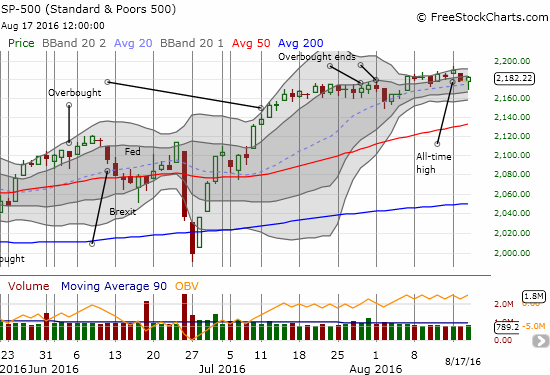
On August 17, 2016, the Federal Reserve released the minutes to its July 26/27 meeting. For whatever reason, the S&P 500 (SPY) pulled back for the first two hours or so after the open and then rallied into and through the release of the minutes. At the height of the sell-off, T2108, the percentage of stocks trading above their respective 40-day moving averages (DMAs), pulled all the way back to 59.4%. At the time, it appeared that the low from the previous pullback would break and thus confirm a bearish turn of events for the stock market.
The volatility index, the VIX, soared enough such that at its high the VIX seemed to flag that the pullback in the market was significant.
Normally, I would go ahead and flip my trading call to at least cautiously bearish under these circumstances. Historically, pullbacks away from the overbought threshold (70%) signal a change in advantage from buyers to sellers – a bearish transition. Wednesday’s plunge in T2108 seems to confirm sellers are regaining control even as the bigger stocks valiantly hold up appearances in the S&P 500. Recall that last year’s steady drift in T2108 away from overbought conditions exposed the underlying weakness in an S&P 500 that was churning just below all-time highs just ahead of what became August angst. However, with the previous low on T2108 holding as support coupled with a dramatic pullback on the VIX, I am inclined to stay at neutral. I am heeding the lesson of the last two episodes where sellers failed miserably to print follow-through.
Still, while the path of least resistance may well have returned to point upward, I am duly noting today’s bearish divergence between the S&P 500 and T2108.
— – —
Reference Charts (click for view of last 6 months from Stockcharts.com):
S&2016-08-17;P 500 or SPY
U.S. Dollar Index (U.S. dollar)
EEM (iShares MSCI Emerging Markets)
VIX (volatility index)
VXX (iPath S&P 500 VIX Short-Term Futures ETN)
EWG (iShares MSCI Germany Index Fund)
CAT (Caterpillar).
IBB (iShares Nasdaq Biotechnology).
Daily T2108 vs the S&P 500
")
Black line: T2108 (measured on the right); Green line: S&P 500 (for comparative purposes)
Red line: T2108 Overbought (70%); Blue line: T2108 Oversold (20%)
Weekly T2108

*All charts created using freestockcharts.com unless otherwise stated
The charts above are the my LATEST updates independent of the date of this given T2108 post. For my latest T2108 post click here.
Related links:
The T2108 Resource Page
Be careful out there!
Full disclosure: long SDS, long UVXY shares and puts, long SVXY puts