
(This is an excerpt from an article I originally published on Seeking Alpha on February 22, 2016. Click here to read the entire piece.)
Sometimes the test of a change in sentiment is not in the pace of the new trend, but instead in the behavior after that trend first gets tested.
{snip}
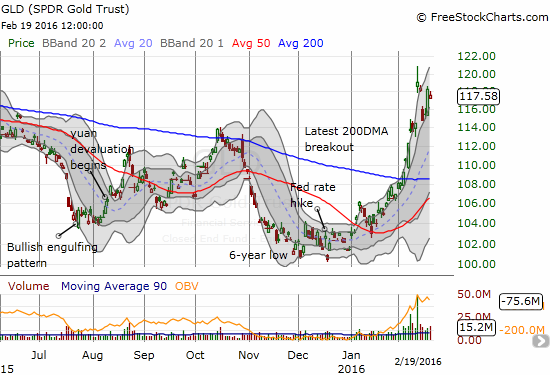
Source: FreeStockCharts.com
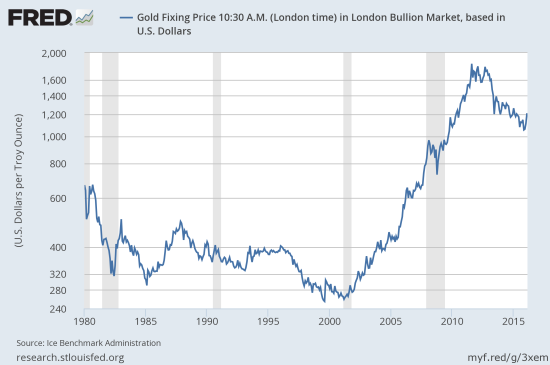
Source: Ice Benchmark Administration, Gold Fixing Price 3:00 P.M. (London time) in London Bullion Market, based in U.S. Dollars [GOLDPMGBD228NLBM], retrieved from FRED, Federal Reserve Bank of St. Louis, February 21, 2016.
Market sentiment is working in the background to support the move in GLD. {snip} The main principle is simple: if the Google Trend for “buy gold” makes a local peak concurrent with an extreme in the price of gold, then odds favor a reversal in direction. This rule applies whether gold has made an extreme move lower or an extreme move higher. {snip}
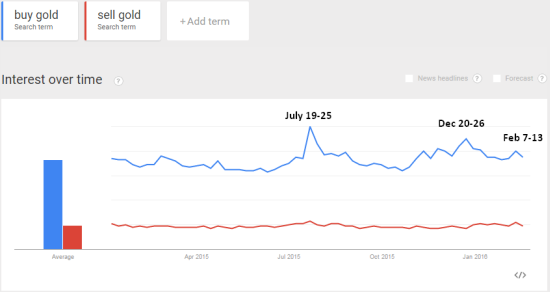
Source: Google Trends
{snip}
I have also recently noticed that the timeframe of the view matters. {snip}
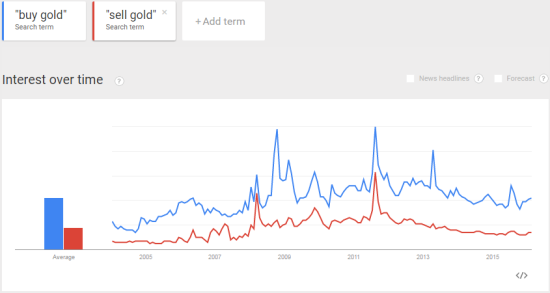
Source: Google Trends
{snip}
Some folks get twisted up trying to look for consistency over time in the way investors and traders assess their willingness to pay for gold. I addressed this in my critique of the “Golden Dilemma.” {snip}
{snip}
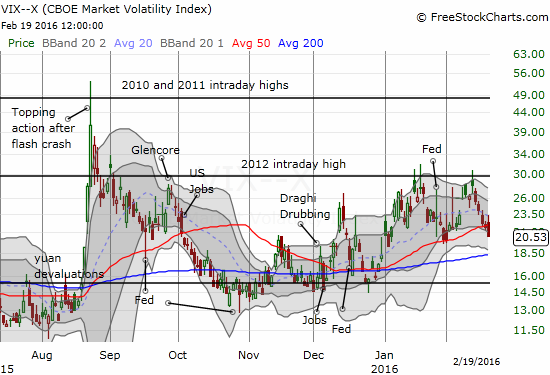
Source: FreeStockCharts.com
I have lately closely watched the market’s expectations for rate hikes from the Federal Reserve. {snip}
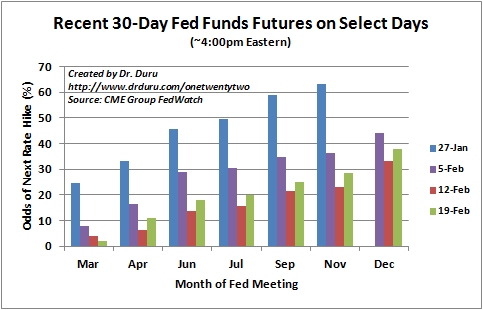
Source: CME Group Fedwatch
Another interesting development is the gold to oil ratio. {snip}

Source: Ice Benchmark Administration, Gold Fixing Price 3:00 P.M. (London time) in London Bullion Market, based in U.S. Dollars [GOLDPMGBD228NLBM], retrieved from FRED, Federal Reserve Bank of St. Louis, February 21, 2016.
US. Energy Information Administration, Crude Oil Prices: West Texas Intermediate (WTI) – Cushing, Oklahoma [DCOILWTICO], retrieved from FRED, Federal Reserve Bank of St. Louis, February 21, 2016.
Traditionally, gold would be considered “over-valued” at such lofty levels versus oil. {snip}
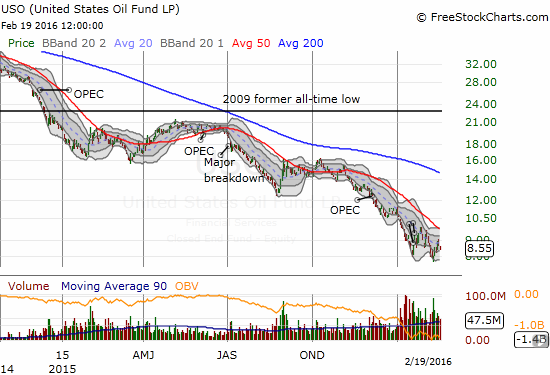
Source: FreeStockCharts.com
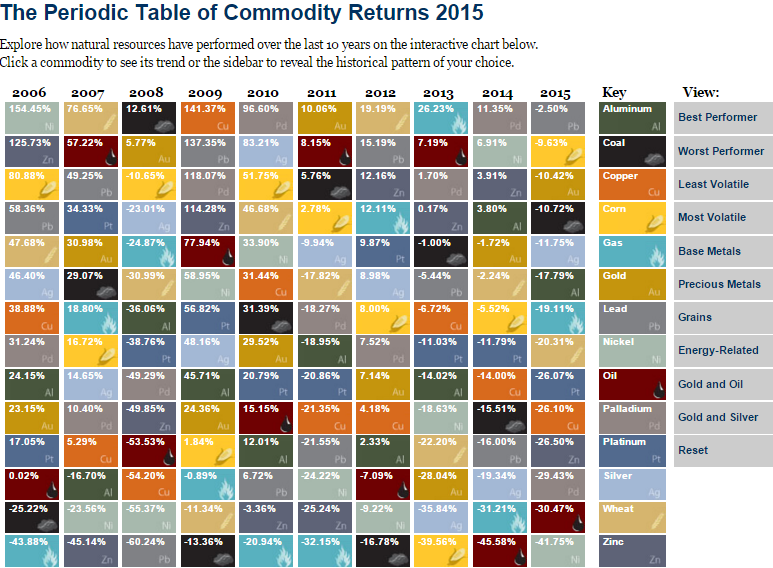
Even if gold cannot help pull oil out of its funk, it may already be supporting other major commodities. {snip}

Source: Business Insider Australia
Like oil, the market dynamics for iron ore are much different than gold. Iron ore has been trapped in a self-reinforcing spiral of over-supply. {snip}
Click image for a larger view…
Source: U.S. Global Investors
Finally, from a technical level, GLD can fall all the way to $109 or $100 before I start to worry about another false breakout for GLD. {snip}
Be careful out there!
Full disclosure: long GLD, long SVXY
(This is an excerpt from an article I originally published on Seeking Alpha on February 22, 2016. Click here to read the entire piece.)