
(T2108 measures the percentage of stocks trading above their respective 40-day moving averages [DMAs]. It helps to identify extremes in market sentiment that are likely to reverse. To learn more about it, see my T2108 Resource Page. You can follow real-time T2108 commentary on twitter using the #T2108 hashtag. T2108-related trades and other trades are occasionally posted on twitter using the #120trade hashtag. T2107 measures the percentage of stocks trading above their respective 200DMAs)
T2108 Status: 85.3%
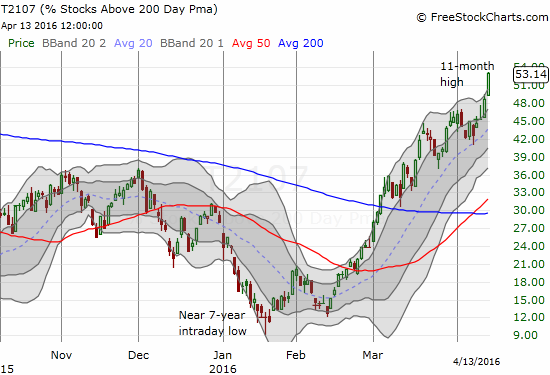
T2107 Status: 53.1% (11-month high)
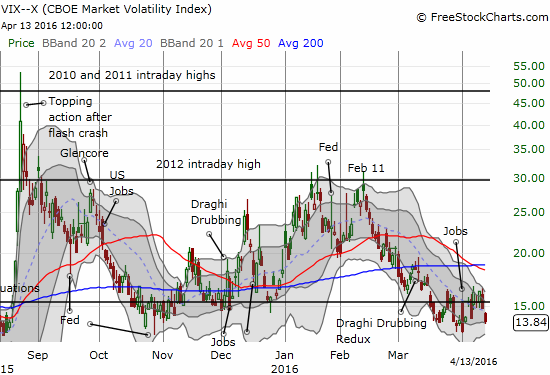
VIX Status: 13.8
General (Short-term) Trading Call: cautiously bullish
Active T2108 periods: Day #43 over 20%, Day #42 over 30%, Day #39 over 40%, Day #36 over 50%, Day #32 over 60%, Day #31 over 70% (overbought), Day #1 over 80%
Commentary
T2107, the percentage of stocks trading above their respective 200-day moving averages (DMAs), is the new star of the show. Today, this technical indicator broke out to an 11-month high and once again affirmed the underlying strength of the stock market.
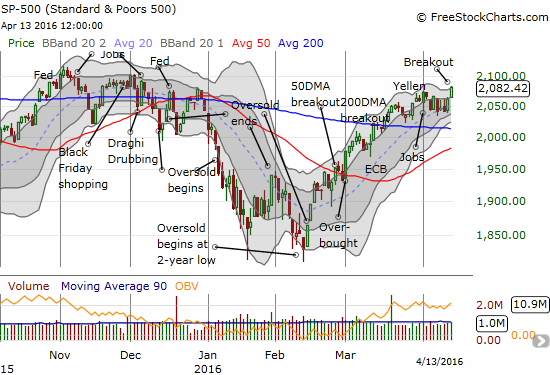
The S&P 500 obliged T2107 with its own breakout. The slippery slope I was watching, and the churn I was expecting, were all wiped away by a breakout on the S&P 500 (SPY). The index gained 1% and closed at its high of the day. The S&P 500 (SPY) is on the edge of a fresh run-up guided upward by the upper-Bollinger Bands.
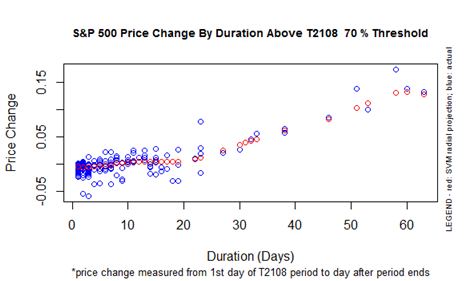
At the same time, T2108, the percentage of stocks trading above their respective 40-day moving averages (DMAs), hurtled over the 80% threshold again. Its close at 85.3% provided the exclamation point to the market’s bullish day. It seems the lift-off implied by the chart below may finally be underway (yes, I keep showing this chart over and over!). T2108 has traded above 70%, in the overbought range, for 31 days.
The VIX dropped close to recent lows and is approaching the “caution” zone of complacency (roughly below 13).
I have bumped the trading call off neutral and back to cautiously bullish. My second moment of wariness proved unwarranted. The S&P 500 is already breaking through resistance created by last year’s declining congestion from November to December. History is on the side of the market as the expected performance for this overbought period increases linearly from here with each passing day. My main challenge is to navigate around this earnings period: just because the overall tone and the underlying structure of the market are bullish, individual stocks do not get automatic passing grades after reporting earnings!
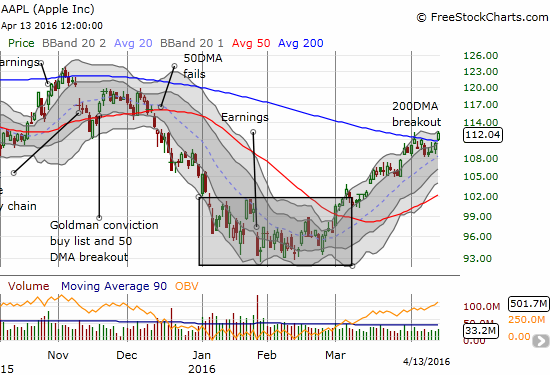
This was the kind of day where a lot of bullish trades went very well. I start my review of individual stocks with Apple (AAPL). It finally broke out from 200DMA resistance and held its ground. During my last moment of wariness, I concluded AAPL would likely remain capped by resistance until earnings could provide a breakthrough catalyst. Instead, AAPL has now joined the ranks of stocks pushing T2107 upward.
The theme for the day, and for most of these charts, is clear: breakout.
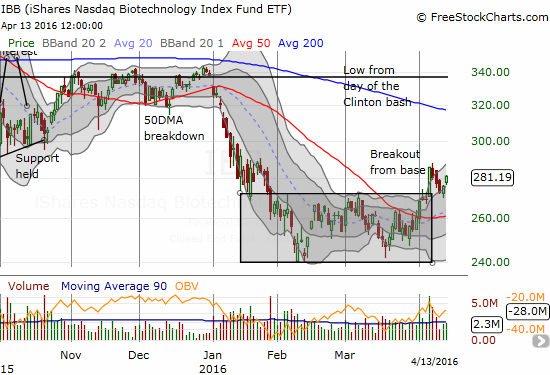
IBB held up its end of the bargain. Sticking to my theme of buying IBB “with confidence,” I added to my call options on the strong open. I locked in profits at the close. I am reloaded and ready to keep buying dips from here…
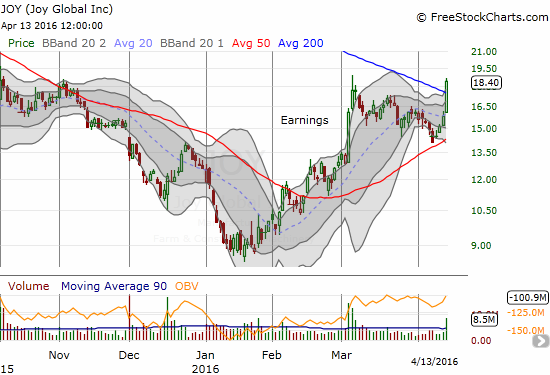
I am back to even on my latest round of Joy Global (JOY) call options. My timing continues to be a bit off on these trades. At least I seem to be getting closer to a big pay-off on this “catch-up” stock. If this breakout holds, I will move to holding shares for a longer period. Time is ticking away on my current position. I decided to hold out for a follow-through day. Either way, I will need to close out on Thursday.
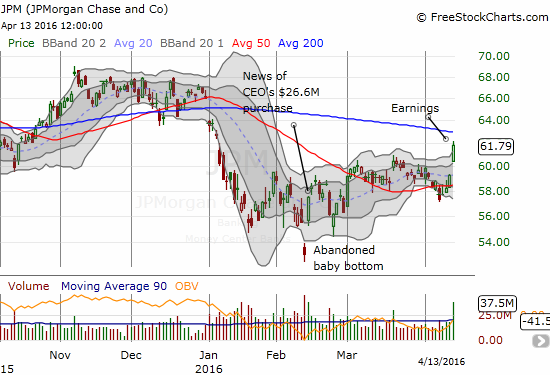
It was very appropriate for JPMorgan Chase (JPM) to breakout on a day like this.
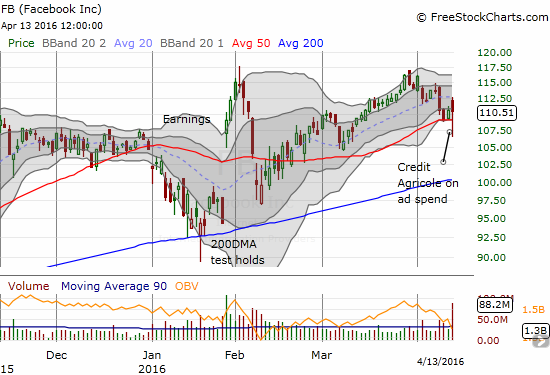
I mentioned in the last T2108 Update that I was impressed by Facebook’s (FB) ability to hold support at its 50DMA, but I did not think it would hold up. Today’s trading looked like it would validate my skepticism as the stock had a near apoplectic reaction to analyst commentary (or at least I assume THAT was the catalyst). At the low of the day, FB was trading on high selling volume, a 50DMA breakout, AND a bearish engulfing move. Perhaps FB lucked out selling off on such a strong market day – it was able to bounce all the way back to flatline by the close. I sold my call options on FB as it hit the 20DMA. That move was in itself extremely fortunate. I did not think about trying to play a fake breakdown.
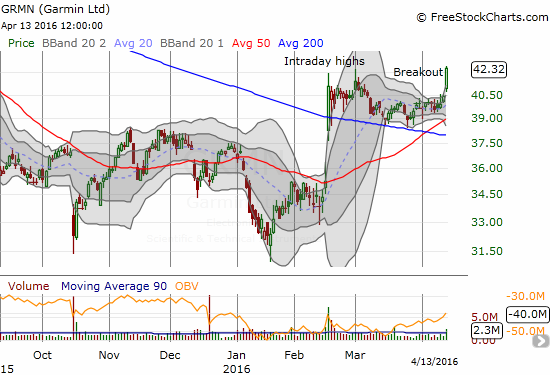
You guessed it. Another breakout. I sold my call options on Garmin (GRMN) into this move. They expire this Friday and this breakout delivered the profits just in time. GRMN has built a solid base supported by 50 and 200DMAs.
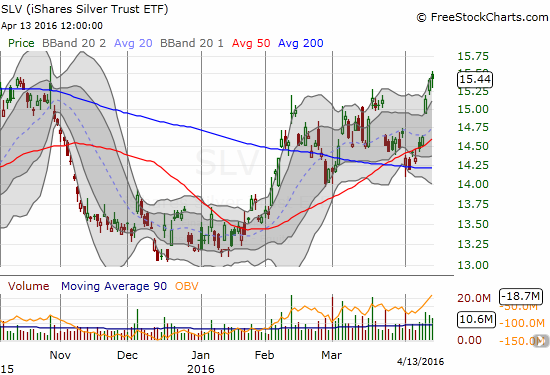
My call options on iShares Silver Trust (SLV) expire next month, so I decided to keep holding. SLV was able to fight off a small dip despite a strong dollar day. Silver has lagged gold, so I want to hang on here in anticipation that this breakout will release some pent-up momentum. I was also motivated to hold on because commodity-related plays are still delivering some of the biggest upside moves in the market. (I am now waaay overdue to get a dedicated commodity-related piece done – especially for iron ore!)
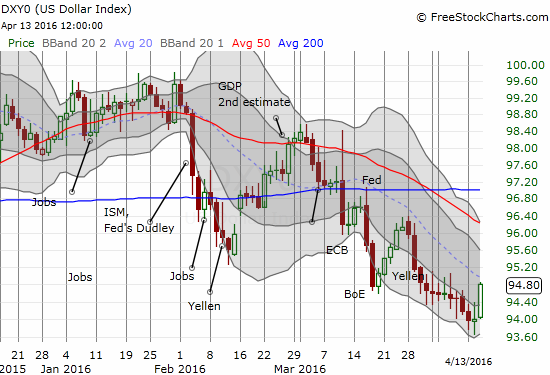
At the time of typing, the U.S. dollar (DXY0) is continuing its momentum from Wednesday in overnight trading. I was most surprised to see commodity-related plays soar despite the U.S. dollar’s strength. However, a look under the covers suggests that carry traders are finally waking up to shorting the euro (FXE) and/or the Japanese yen (FXY) in order to get on the commodity train. With interest rates still poised to rise in the U.S., it makes little sense to short the U.S. dollar for a carry trade.
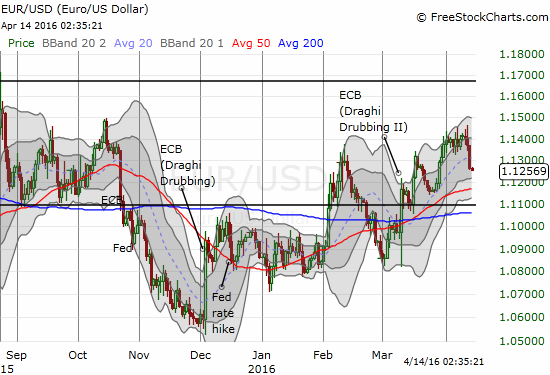
Mario Draghi, President of the European Central Bank (ECB), may now heave a sigh of relief…
— – —
For readers interested in reviewing my trading rules for an oversold T2108, please see my post in the wake of the August Angst, “How To Profit From An EPIC Oversold Period“, and/or review my T2108 Resource Page.
Reference Charts (click for view of last 6 months from Stockcharts.com):
S&P 500 or SPY
U.S. Dollar Index (U.S. dollar)
EEM (iShares MSCI Emerging Markets)
VIX (volatility index)
VXX (iPath S&P 500 VIX Short-Term Futures ETN)
EWG (iShares MSCI Germany Index Fund)
CAT (Caterpillar).
IBB (iShares Nasdaq Biotechnology).
(Click on the image, if it is not correct. That will force a refresh)
Daily T2108 vs the S&P 500
")
Black line: T2108 (measured on the right); Green line: S&P 500 (for comparative purposes)
Red line: T2108 Overbought (70%); Blue line: T2108 Oversold (20%)
Weekly T2108

*All charts created using freestockcharts.com unless otherwise stated
The charts above are the my LATEST updates independent of the date of this given T2108 post. For my latest T2108 post click here.
Related links:
The T2108 Resource Page
Expanded daily chart of T2108 versus the S&P 500
Expanded weekly chart of T2108
Be careful out there!
Full disclosure: short FB, short EUR/USD, short and long various currencies against the U.S. dollar, long JOY call options, long SLV call options