
(T2108 measures the percentage of stocks trading above their respective 40-day moving averages [DMAs]. It helps to identify extremes in market sentiment that are likely to reverse. To learn more about it, see my T2108 Resource Page. You can follow real-time T2108 commentary on twitter using the #T2108 hashtag. T2108-related trades and other trades are occasionally posted on twitter using the #120trade hashtag. T2107 measures the percentage of stocks trading above their respective 200DMAs)
T2108 Status: 80.6%
T2107 Status: 32.2%
VIX Status: 18.7
General (Short-term) Trading Call: cautiously bullish
Active T2108 periods: Day #18 over 20%, Day #17 over 30%, Day #14 over 40%, Day #11 over 50%, Day #7 over 60%, Day #6 over 70%, Day #4 over 80% (overbought)
Commentary
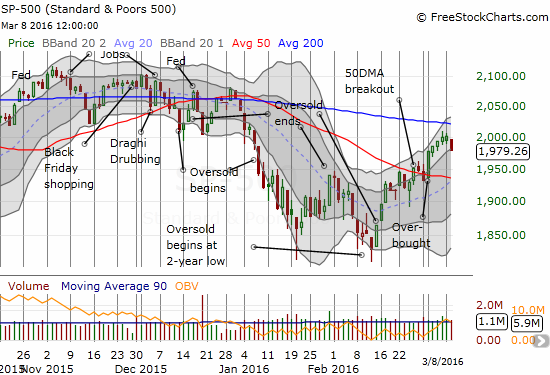
In the last T2108 Update I described a synchronous failure of market leaders. These same leaders followed-up with an attempted rally that fizzled across the board with all closing the day flat. The S&P 500 could not hold flat and instead lost 1.1%.
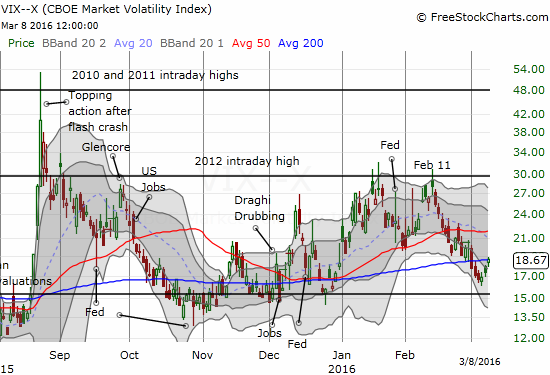
The volatility index, the VIX, gained for the third straight day. I had previously expected a rendezvous with the old 15.35 pivot. Instead, the VIX may have another rally to go before sinking that low again.
T2108, the percentage of stocks trading above their respective 40-day moving averages (DMAs), fell along with the market. It closed at 80.6%. This is only the fourth loss since the February 11 low at oversold conditions. The decline in T2107, the percentage of stocks trading above their respective 200DMAs, fell for only the third day since February 11th’s low. The decline from 35.7% to 32.2% was significant and confirms the market’s first notable setback in this bounce from oversold conditions.
I am keeping the trading call at “cautiously bullish.” Recall that I am not flipping bearish until the S&P 500 (SPY) falls below and follows through its selling below its 50DMA AND after T2108 has fallen from overbought conditions. If T2107 shows significant weakness, I could pull the trigger on bearishness a little earlier.
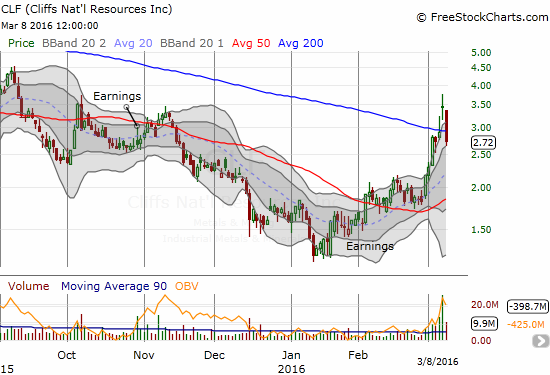
Speculative stocks were particularly hard hit. These are stocks that have enjoyed out-sized gains in this rally; membership has been dominated by commodity-related stocks. For example, Cliffs Natural Resources Inc (CLF) plunged 20.7% and fell back under its 200DMA.
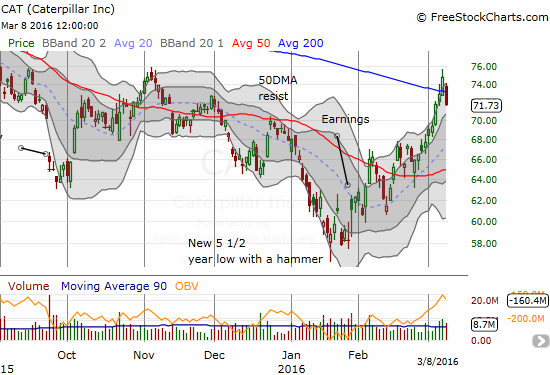
Even Caterpillar (CAT) sank under its 200DMA.
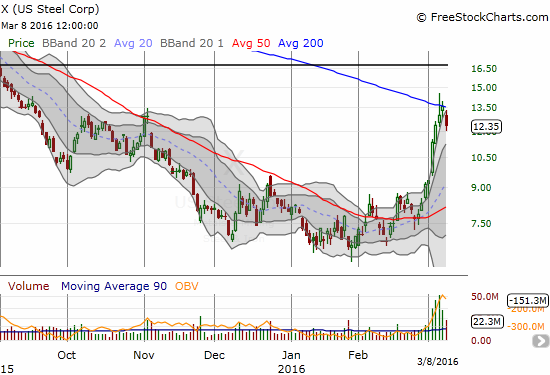
U.S. Steel (X) is on the verge of confirming resistance at its 200DMA.
These are just examples of what a sinking T2107 meant for the market today. They confirm today as a notable day of setbacks for this rally.
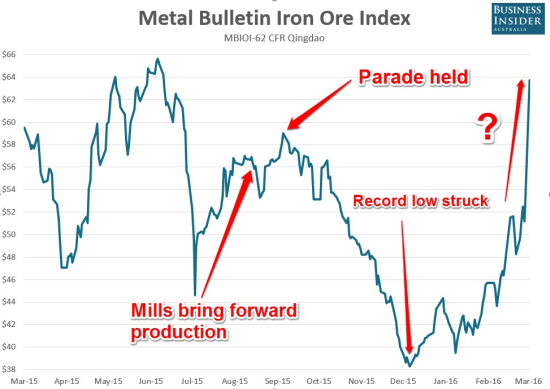
The sharp move in iron ore particularly concerns me. These kinds of moves are typically a rally’s last gasp as buyers finally exhaust themselves in one last panicked buying spree. Sure enough, the immediate aftermath of Monday’s sharp spike has created major reversals like in CLF.
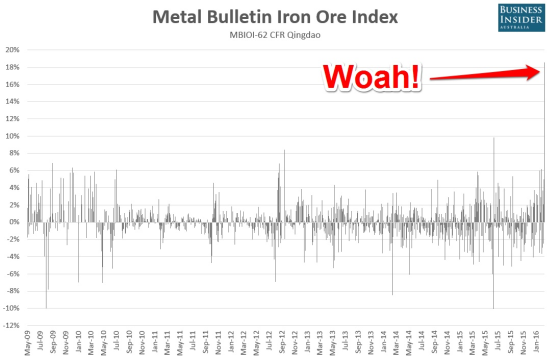
When I wrote “Glencore’s Instructive Reversal On Commodity Prices,” I did not cover the insane gain in iron ore from Monday. Its price surged 20% in a move that had to include a lot of short-covering. This conclusion was echoed by traders and analysts. Even industrial mining giants cast doubts on the sustainability of the move as quoted in the Sydney Morning Herald in “Iron ore price leap stuns industry’s top brass.” The mechanics of the move were also discussed in an aptly titled Bloomberg article: “Iron Ore Jumps Most on Record as Market Goes ‘Berserk’.” Business Insider Australia provided some context in “CHART: The overnight surge in iron ore nearly doubled the previous record gain.”
Apparently, shorts are also running from their bets against oil. In “Specter of $20 Oil Recedes as Speculators Flee Bearish Bets,” Bloomberg notes “hedge funds unwound bearish bets at the fastest pace in 10 months…Speculators’ short positions in WTI fell by 25,639 contracts of futures and options combined to 150,718, the biggest decline since April 21, CFTC data show. Longs, or bets on rising prices, fell by 753. The exodus of bearish bets resulted in a 24,886-contract jump in the net-long position.”
I am more worried about iron ore than oil for now because of iron ore’s heavy dependence on China’s economy.
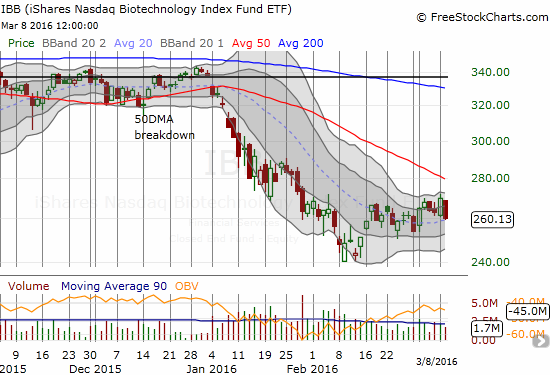
Speaking of speculative stocks, I have not posted a chart of iShares Nasdaq Biotechnology (IBB) in a long while. Biotech stocks have benefited little from the current rally as IBB has largely churned in a tight range since the initial bounce from the February 11 lows. Today, IBB fell 3.6%.
— – —
For readers interested in reviewing my trading rules for an oversold T2108, please see my post in the wake of the August Angst, “How To Profit From An EPIC Oversold Period“, and/or review my T2108 Resource Page.
Reference Charts (click for view of last 6 months from Stockcharts.com):
S&P 500 or SPY
U.S. Dollar Index (U.S. dollar)
EEM (iShares MSCI Emerging Markets)
VIX (volatility index)
VXX (iPath S&P 500 VIX Short-Term Futures ETN)
EWG (iShares MSCI Germany Index Fund)
CAT (Caterpillar).
IBB (iShares Nasdaq Biotechnology).
Daily T2108 vs the S&P 500
")
Black line: T2108 (measured on the right); Green line: S&P 500 (for comparative purposes)
Red line: T2108 Overbought (70%); Blue line: T2108 Oversold (20%)
Weekly T2108

*All charts created using freestockcharts.com unless otherwise stated
The charts above are the my LATEST updates independent of the date of this given T2108 post. For my latest T2108 post click here.
Related links:
The T2108 Resource Page
Expanded daily chart of T2108 versus the S&P 500
Expanded weekly chart of T2108
Be careful out there!
Full disclosure: short FB, long FB call options, long CAT put options