
(T2108 measures the percentage of stocks trading above their respective 40-day moving averages [DMAs]. It helps to identify extremes in market sentiment that are likely to reverse. To learn more about it, see my T2108 Resource Page. You can follow real-time T2108 commentary on twitter using the #T2108 hashtag. T2108-related trades and other trades are occasionally posted on twitter using the #120trade hashtag. T2107 measures the percentage of stocks trading above their respective 200DMAs)
T2108 Status: 20.8% (2nd day in a row T2108 dipped into oversold territory intraday)
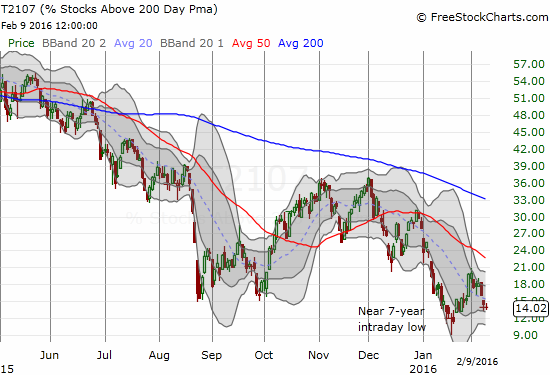
T2107 Status: 14.0%
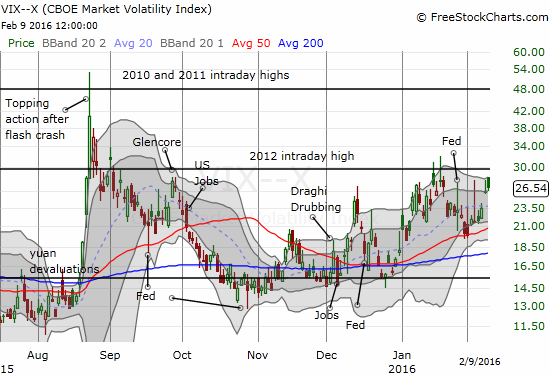
VIX Status: 26.5
General (Short-term) Trading Call: bullish
Active T2108 periods: Day #8 over 20% (overperiod), Day #26 under 30% (underperiod), Day #42 under 40%, Day #46 below 50%, Day #61 under 60%, Day #402 under 70%
Commentary
For the second day in a row, the S&P 500 (SPY) experienced wide-ranging trading action often seen during bear markets. Sellers and buyers took the index on a wild ride of despair and hope. Both the S&P 500 and the NASDAQ (QQQ) are sitting at 15-month closing lows.
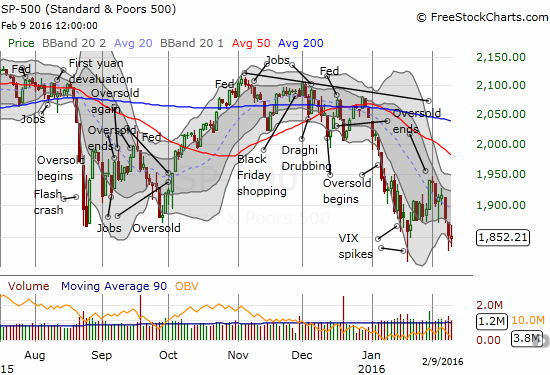

With both major indices limping so notably, I am surprised T2108, the percentage of stocks trading above their 40-day moving averages (DMAs), is not already in oversold territory. Instead, my favorite technical indicator has managed to close just above the 20% threshold two days in a row. Both days, T2108 managed to drop into oversold territory for a brief spell. T2108 is barely hanging on, floating above oversold territory.

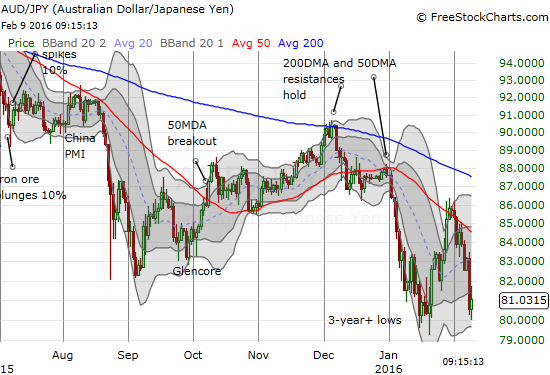
The currency markets are reflecting the tension in the market. The Japanese yen (FXY) has sprung back to life and put us back on notice with negative market sentiment. In particular, the Australian dollar versus the yen, AUD/JPY, has plunged back to 3+ year lows. Resistance at the 50DMA held again.
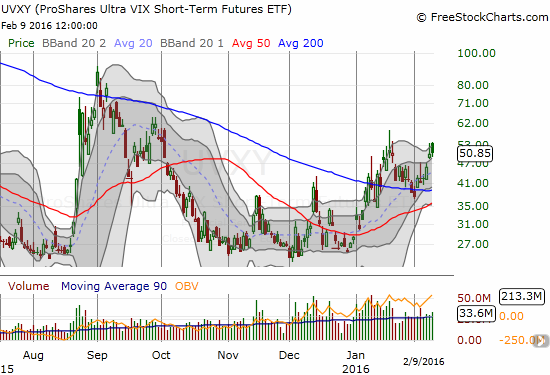
The collective tension is thick – just in time for Janet Yellen, the chair of the U.S. Federal Reserve, to attempt a rescue plan. Her testimony in front of Congress for the next two days has the potential to turn around negative market sentiment. If the Fed’s typical anti-volatility efforts turn sour, sellers could punish the market into a brand new phase of selling. I have chosen to make my typical pre-Fed, anti-volatility bet. I covered my short put on ProShares Ultra VIX Short-Term Futures (UVXY) on Monday. Today, I loaded up long UVXY puts. Volatility cooperated going into the close as it seems other traders also want to position to avoid fighting the Fed.
While my trading call remains bullish and T2108 sits on top of oversold conditions, I have ADDED new bearish positions as hedges. I am VERY wary of the trading action. Sellers have simply had their way with little fight from buyers. Financials in particular are looking increasingly vulnerable, and I finally made a big move in this sector. I bought put options against Financial Select Sector SPDR ETF (XLF) and Deutsche Bank AG (DB). DB has been cratering for quite some time and now sits at a fresh all-time low.
A lot is sitting on Yellen’s shoulders now. Even the U.S. Dollar index (DXY0) is barely holding on!

If Yellen calms the market, the dollar index is likely to fall further. If she sticks to the script of “rate normalization” that has put the Fed on an island of monetary policy, the stock market is likely to fall further. Either way, I expect more wide-ranging trading action and will be even more keen to look for intraday trading opportunities.
— – —
For readers interested in reviewing my trading rules for T2108, please see my post in the wake of the August Angst, “How To Profit From An EPIC Oversold Period“, and/or review my T2108 Resource Page.
Reference Charts (click for view of last 6 months from Stockcharts.com):
S&P 500 or SPY
U.S. Dollar Index (U.S. dollar)
EEM (iShares MSCI Emerging Markets)
VIX (volatility index)
VXX (iPath S&P 500 VIX Short-Term Futures ETN)
EWG (iShares MSCI Germany Index Fund)
CAT (Caterpillar).
IBB (iShares Nasdaq Biotechnology).
Daily T2108 vs the S&P 500
")
Black line: T2108 (measured on the right); Green line: S&P 500 (for comparative purposes)
Red line: T2108 Overbought (70%); Blue line: T2108 Oversold (20%)
Weekly T2108

*All charts created using freestockcharts.com unless otherwise stated
The charts above are the my LATEST updates independent of the date of this given T2108 post. For my latest T2108 post click here.
Related links:
The T2108 Resource Page
Expanded daily chart of T2108 versus the S&P 500
Expanded weekly chart of T2108
Be careful out there!
Full disclosure: long SSO call options, long SSO shares, long SVXY shares, long UVXY puts, net long the U.S. dollar, short AUD/JPY
I think we are now seeing a retest of the January lows.
A lot needs to be wrung out of the old bull market. The VIX was above 30 at one point today, which is good. Individual investors are very pessimistic, which is good. The market is testing the Jan. lows, which is good.
But I don’t see enough fear yet to start a significant rally. And probably that would be a rally within a bear market, not a sustained uptrend.
Probably we will need another leg down. But we could get a fakeout rally first. That’s happened before, and I sure wouldn’t be a buyer in that…..
Given the perceived negativity, I am very surprised the VIX hasn’t gone higher. It is still failing at resistance. Normally I would think that is bullish. We are finally oversold today, so I reset the clock. Looking like the next leg lower is on the horizon. Gulp.