
(T2108 measures the percentage of stocks trading above their respective 40-day moving averages [DMAs]. It helps to identify extremes in market sentiment that are likely to reverse. To learn more about it, see my T2108 Resource Page. You can follow real-time T2108 commentary on twitter using the #T2108 hashtag. T2108-related trades and other trades are occasionally posted on twitter using the #120trade hashtag. T2107 measures the percentage of stocks trading above their respective 200DMAs)
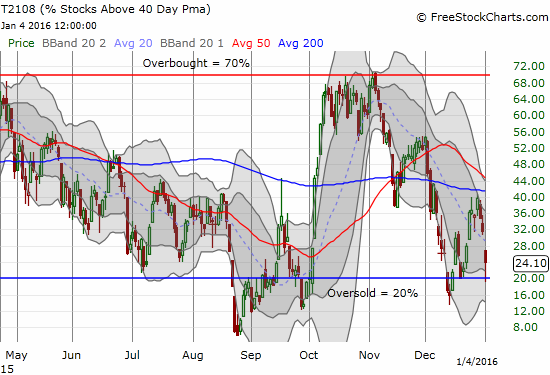
T2108 Status: 24.1%
T2107 Status: 23.8%
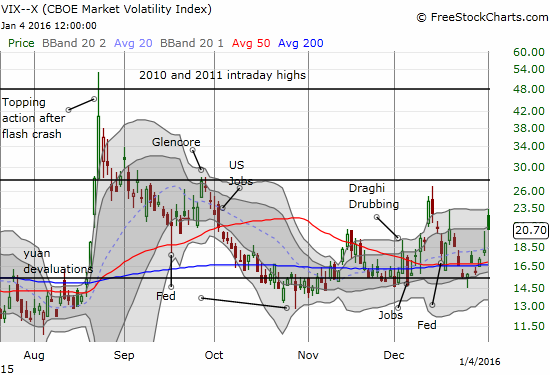
VIX Status: 20.7 (elevated)
General (Short-term) Trading Call: bullish – see below for caveats
Active T2108 periods: Day #13 over 20%, Day #1 under 30% (ending 6 days over 30%) (underperiod), Day #17 under 40%, Day #21 below 50%, Day #36 under 60%, Day #377 under 70%
Reference Charts (click for view of last 6 months from Stockcharts.com):
S&P 500 or SPY
SDS (ProShares UltraShort S&P500)
U.S. Dollar Index (volatility index)
EEM (iShares MSCI Emerging Markets)
VIX (volatility index)
VXX (iPath S&P 500 VIX Short-Term Futures ETN)
EWG (iShares MSCI Germany Index Fund)
CAT (Caterpillar).
IBB (iShares Nasdaq Biotechnology).
Commentary
So much for the S&P 500 (SPY) showing signs of firming! In my last T2108 Update, I viewed the last positive days of the Santa Claus rally with great favor because of the breakout above resistance at the 50 and 200-day moving averages (DMAs). T2108, the percentage of stocks trading above their respective 40DMAs, also looked very strong. At least I pointed out that the volatility index, the VIX, had not yet provided its “all clear.” Most importantly, I included this caveat: “For bullish confirmation, I am looking for the S&P 500 to print a strong close above the downtrend line pointed out above. I am still getting over my surprise that the index managed to close so strongly above combined resistance at the 50 and 200DMAs.” Sure enough, the S&P 500 failed to provide that confirmation: that short-term downtrend remains firmly in place…
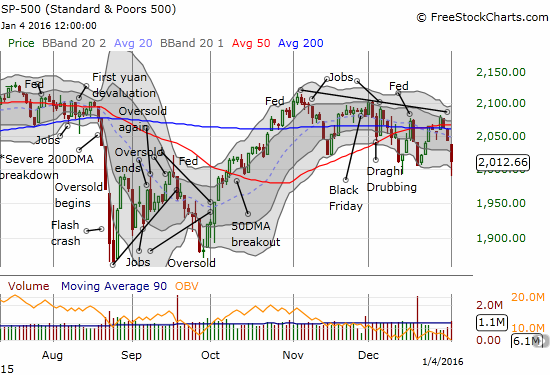
…moreover, the 50 and 200DMAs once again look like firm resistance. The Santa Claus rally ended with a whimper and a much more modest gain of 1.1% thanks to two days of low-volume selling to close the year. That selling carried into 2016 on very strong volume. The selling was strong enough to send T2108 into oversold territory for just under 30 minutes.
%stocks>40DMA briefly dipped below oversold threshold (20%). Low of day is 19.6%. $SPY #T2108 trading rules apply. https://t.co/iokuPhxlJk
— Dr. Duru (@DrDuru) January 4, 2016
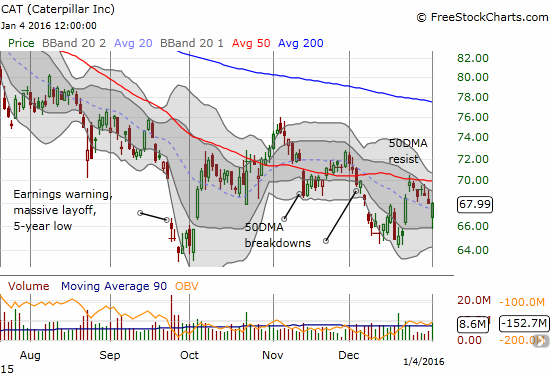
Since T2108 gapped down all the way to 27.6% at the open and within 5 minutes went to 23%, I went into “oversold” trading mode even ahead of the official threshold. My put options on iShares MSCI Emerging Markets (EEM) took care of themselves on a limit order (I came out net positive on the latest hedged trade on EEM). Most importantly, I sold my large put option position on my favorite hedge against bullishness: Caterpillar (CAT). CAT was down over 2% and had reversed all the gins from December 22nd’s big pop that I faded. The move reminded me of the power of oversold trading conditions. CAT closed UP on the day; a small sliver of light for bulls and buyers given China was a heavy part of the bear case on the day.
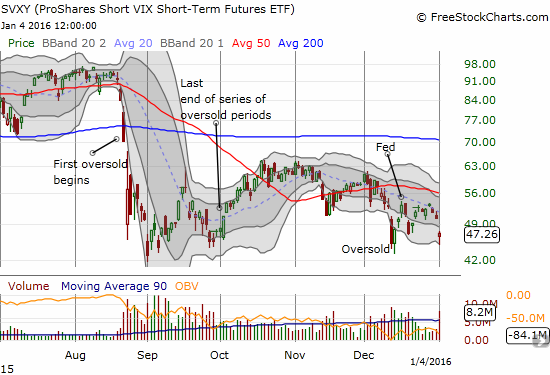
On the long side, I executed a strategy that I have revised since the multiple oversold periods starting with teh August Angst of last year. I did not move as aggressively as I have typically done in the past. I started with a small number of shares long ProShares Short VIX Short-Term Futures (SVXY). I intended to add call options on ProShares Ultra S&P500 (SSO) if the market dove deeper into oversold territory by the close. I would also add to my SVXY position in subsequent days if the oversold period dragged on. As it turned out, the bounce off the lows faded volatility (the VIX) and delivered a small gain on my SVXY position.
While all these trades were good reminders of the usefulness of moving ahead of T2108’s rendezvous with official oversold territory, these shifts in positioning still produce discomfort. I am left with a greatly reduced hedge (I am still very much long put options on iron ore plays) while adding to bullish positions. If the oversold condition does not end quickly as expected, then I have to figure out how to accumulate long positions without adding so much risk that I cannot see the trades through the inevitable end of oversold trading. On this day, things worked out fine, and I actually started 2016 with a nice gain as a result. However, I am still uncomfortable and unsettled, and I have a quick trigger finger for profits on the bullish side while the S&P 500 is below critical resistance.
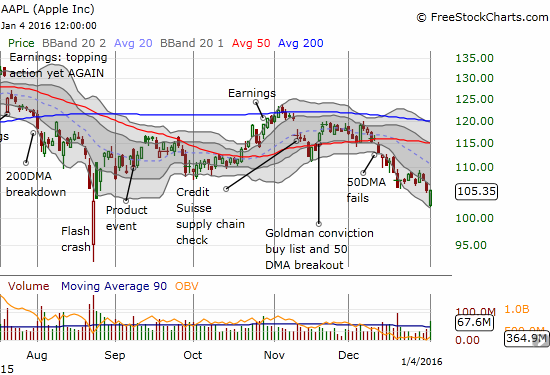
Apple (AAPL) was a case in point. I bought call options on AAPL soon after the open with an expiration for NEXT week and a plan to accumulate more on further selling. AAPL was touching the lower-BB, but I figured there was further risk that sellers would get aggressive enough to stretch the rubber band lower as in previous selling bouts. As it turned out, AAPL staged a very impressive comeback. Like CAT, AAPL closed the day with a slight gain and left a sliver of hope for bulls and buyers. I chose to lock in my profits on that rally.
$AAPL leading charge for an oversold relief bounce. Trading near high of the day off low around $102.
— Dr. Duru (@DrDuru) January 4, 2016
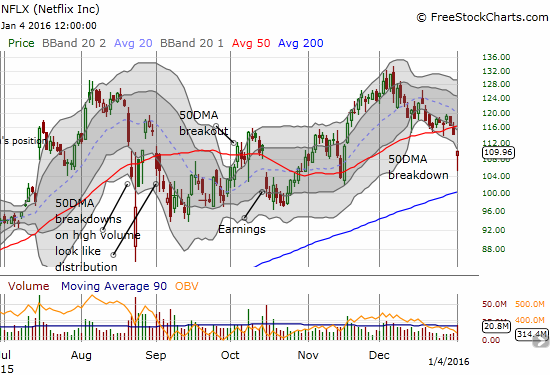
I also went after Netflix (NFLX) but held onto those call options. This was an “easier” trade because NFLX was well below its lower-BB when I made my move. I am holding for just one day of follow-through buying…
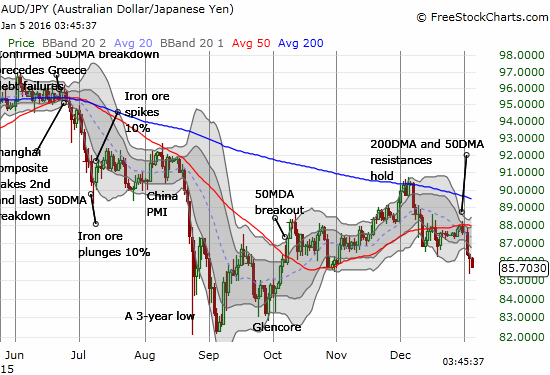
As I write this, the Japanese yen (FXY) is experiencing a fresh wave of strength. As I pointed out in “The Japanese Yen Flashes Red for 2016,” the on-going strengthening in the Japanese yen serves as an unsettling tale of caution at this market juncture. Traders ignore the currency market during times like this at great risk. The Australian dollar (FXA) bounced against the Japanese yen into the close of U.S. trading as a confirmation of improved market sentiment. Overnight trading is NOT delivering follow-through…
So another year starts off on a negative note. I am sure the mainstream press is pulling out the annual talk about the “January barometer.” At one point, I heard the ominous observation that the Dow Jones Industrials had not performed so badly to start a year since 1932. The rally into the close wiped history to a fast forward to 2008. The S&P 500 is the better indicator of market action anyway. The timeline of start-of-the-year performances reminds us of the commonness of poor starts to the year (a big explanation for the failure of the January barometer). (The red dot represents 2016)
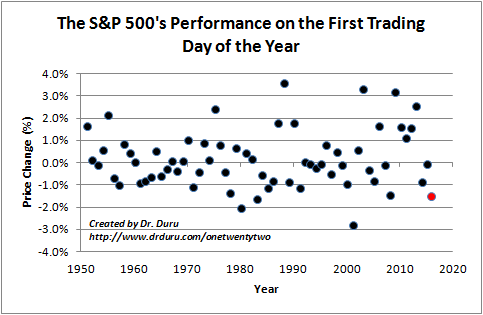
Source for price data: Yahoo Finance
In previous posts, I have pointed out the flaw in the January barometer. I even went so far as to predict that the barometer would fail again in 2015. The barometer finally delivered thanks to 2015’s last trading day. While I want to stay skeptical of this barometer for 2016 as well, I am worried that the recent selling has finally confirmed a lasting top in the market. Even if the S&P 500 manages to print a new all-time high this year, I strongly suspect it will only happen after washing out more investors with a retest of last year’s oversold conditions and the August/October lows. Such a retest would be very consistent with my analysis last year showing how a decline in the 200DMA soon after the S&P 500 hit its last all-time high warned of a large drawdown to come. Buckle up!
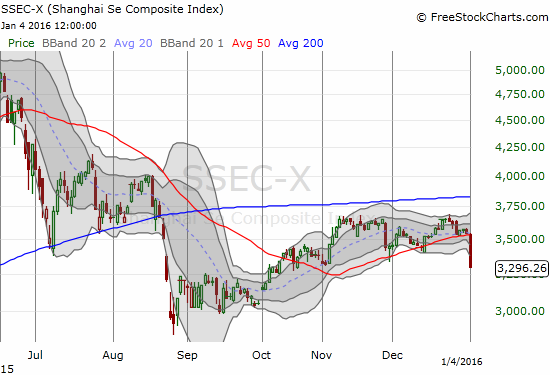
Addendum: Here is a chart of the Shanghai Composite Index – the big breakdown that unsettled the world to start 2016…
Daily T2108 vs the S&P 500
")
Black line: T2108 (measured on the right); Green line: S&P 500 (for comparative purposes)
Red line: T2108 Overbought (70%); Blue line: T2108 Oversold (20%)
Weekly T2108

*All charts created using freestockcharts.com unless otherwise stated
The charts above are the my LATEST updates independent of the date of this given T2108 post. For my latest T2108 post click here.
Related links:
The T2108 Resource Page
Expanded daily chart of T2108 versus the S&P 500
Expanded weekly chart of T2108
Be careful out there!
Full disclosure: long SVXY shares, long NFLX call options, net short the Australian dollar, long and short various currencies against the Japanese yen