
(T2108 measures the percentage of stocks trading above their respective 40-day moving averages [DMAs]. It helps to identify extremes in market sentiment that are likely to reverse. To learn more about it, see my T2108 Resource Page. You can follow real-time T2108 commentary on twitter using the #T2108 hashtag. T2108-related trades and other trades are occasionally posted on twitter using the #120trade hashtag. T2107 measures the percentage of stocks trading above their respective 200DMAs)
T2108 Status: 38.1%
T2107 Status: 25.5%
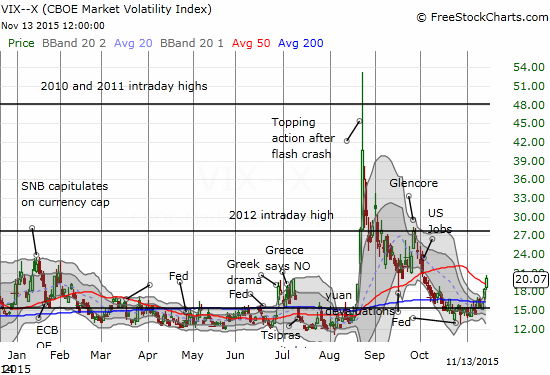
VIX Status: 20.1
General (Short-term) Trading Call: bearish
Active T2108 periods: Day #30 over 20%, Day #29 over 30%, Day #1 under 40% (ending 28 days over 40%) (underperiod), Day #2 below 50%, Day #4 under 60%, Day #344 under 70%
Reference Charts (click for view of last 6 months from Stockcharts.com):
S&P 500 or SPY
SDS (ProShares UltraShort S&P500)
U.S. Dollar Index (volatility index)
EEM (iShares MSCI Emerging Markets)
VIX (volatility index)
VXX (iPath S&P 500 VIX Short-Term Futures ETN)
EWG (iShares MSCI Germany Index Fund)
CAT (Caterpillar).
IBB (iShares Nasdaq Biotechnology).
Commentary
I am keeping this update short given the tragic terrorist attack in Paris Friday night, November 13th. It is very possible that the nature and tenor of trading change as a result. I visited Paris for the first time last year. Although it was a quick day trip in the middle of a layover, I thoroughly enjoyed myself and still look forward to visiting again one day soon. My prayers go out to everyone impacted by this atrocity.

The S&P 500 (SPY) lost 1.1% on the day, and finished the week with a 3.6% loss. It was a week the began ominously; the selling validated the alarm bells I rang to start the week.
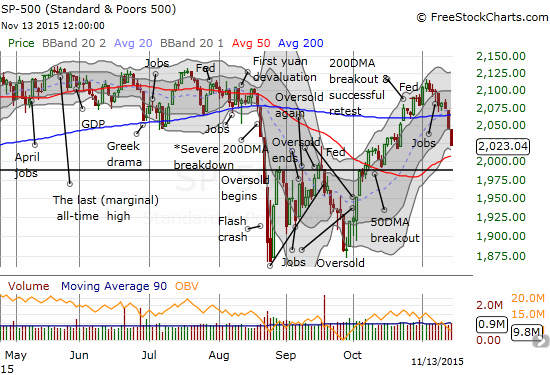
The 50-day moving average (DMA) is trending upward, so a test of this support is very critical for the S&P 500. The potential test comes with T2108 plunging from 61.7% to start the week to 38.1% to close the week.
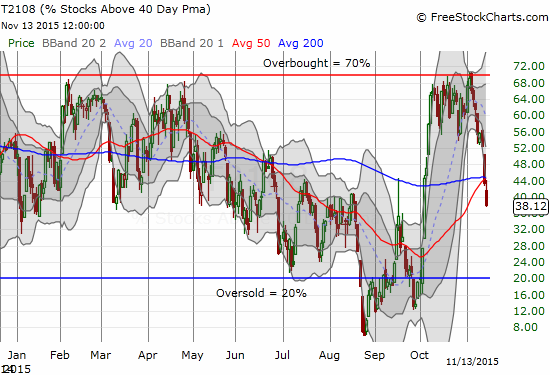
Once T2108 drops into the 30s, I start to think about oversold trading conditions. In recent years, the low 30s have served as “close enough” to trigger a (short-term) bottom in the trading action. In this case, I am more interested in fading volatility than playing the S&P 500. I strongly suspect that any bounce in the S&P 500 will be short-lived and capped by its 200DMA. The volatility index, the VIX, is reaching “elevated” status at 20.1. I would target a return to the 15.35 pivot on a fade and make the trade a quick flip on shares of ProShares Short VIX Short-Term Futures (SVXY).
For trading, I unloaded a lot of put options Thursday and Friday. These were positions primarily on stocks I featured in various charts during the week. I was glad to have them convert so quickly. I dabbled i some call options on select positions.
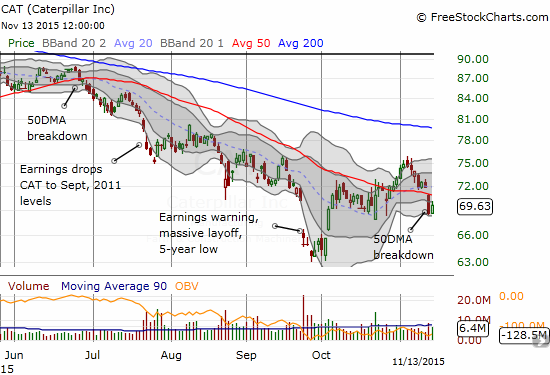
One small sign that things could soon turn for the buyers and bulls is Caterpillar (CAT). It made a very bearish breakdown with a gap down below its 50DMA on Thursday, but on Friday the stock showed very surprising relative strength. CAT managed to rally while most of the market was selling off.
Daily T2108 vs the S&P 500
")
Black line: T2108 (measured on the right); Green line: S&P 500 (for comparative purposes)
Red line: T2108 Overbought (70%); Blue line: T2108 Oversold (20%)
Weekly T2108

*All charts created using freestockcharts.com unless otherwise stated
The charts above are the my LATEST updates independent of the date of this given T2108 post. For my latest T2108 post click here.
Related links:
The T2108 Resource Page
Expanded daily chart of T2108 versus the S&P 500
Expanded weekly chart of T2108
Be careful out there!
Full disclosure: short CAT