
(T2108 measures the percentage of stocks trading above their respective 40-day moving averages [DMAs]. It helps to identify extremes in market sentiment that are likely to reverse. To learn more about it, see my T2108 Resource Page. You can follow real-time T2108 commentary on twitter using the #T2108 hashtag. T2108-related trades and other trades are occasionally posted on twitter using the #120trade hashtag. T2107 measures the percentage of stocks trading above their respective 200DMAs)
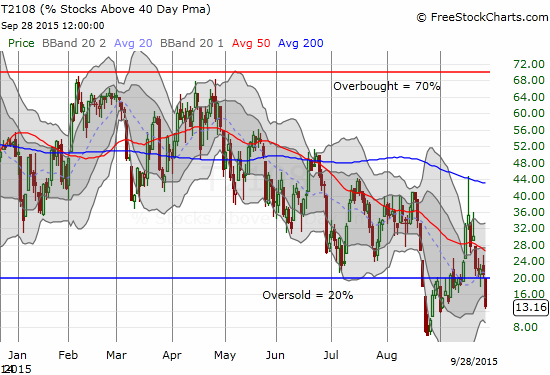
T2108 Status: 13.2% (drop from 21.1%)
T2107 Status: 16.6%
VIX Status: 27.6 (an increase of 17.0%)
General (Short-term) Trading Call: Bullish (upside target of 1996 on the S&P 500 before overbought conditions finally occur again. See “From the Edge of A Breakout to the Ledge of A Breakdown” for more details).
Active T2108 periods: Day #1 under 20% (first day of oversold period ended just 9 days above 20%), Day #7 under 30%, Day #29 under 40%, Day #89 under 50%, Day #106 under 60%, Day #311 under 70%
Reference Charts (click for view of last 6 months from Stockcharts.com):
S&P 500 or SPY
SDS (ProShares UltraShort S&P500)
U.S. Dollar Index (volatility index)
EEM (iShares MSCI Emerging Markets)
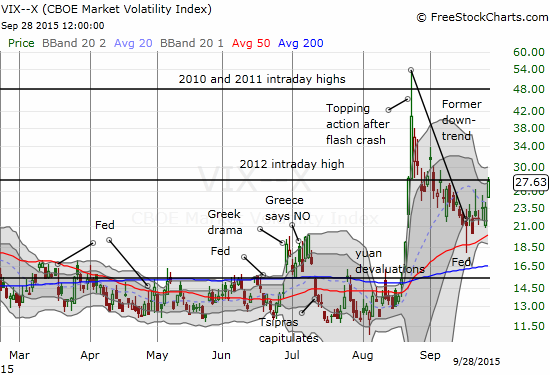
VIX (volatility index)
VXX (iPath S&P 500 VIX Short-Term Futures ETN)
EWG (iShares MSCI Germany Index Fund)
CAT (Caterpillar).
IBB (iShares Nasdaq Biotechnology).
Commentary
Last week’s close calls have turned into a prelude.
On Monday, September 28, 2015, the sellers took center stage and full control of the market action. T2108 dropped back into oversold conditions for the third time in a month. This latest plunge defied my expectations for the S&P 500 (SPY) to hold up long enough for retests of resistance at the 50 and 200-day moving averages (DMA).
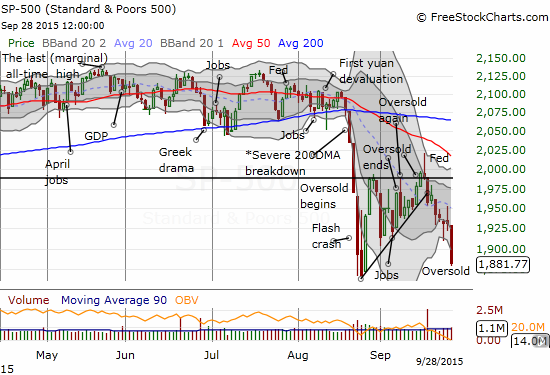
The sellers demonstrated their strength by closing the S&P 500 well below the lower-Bollinger Band (BB). As a reminder the lower-BB measures a TWO standard deviation move away from the 20-day moving average. The S&P 500 is now dangerously close to retesting its lows from the flash crash. If this line in the sand melts away then the next stop must surely be the lows from the oversold period of October, 2014: a 1820 target for the S&P 500.
The NASDAQ (QQQ) was of course hit as well. The only thing different between the relative positions of the NASDAQ and S&P 500 is that the NASDAQ has more cushion left before a retest of the intraday lows from the flash crash.
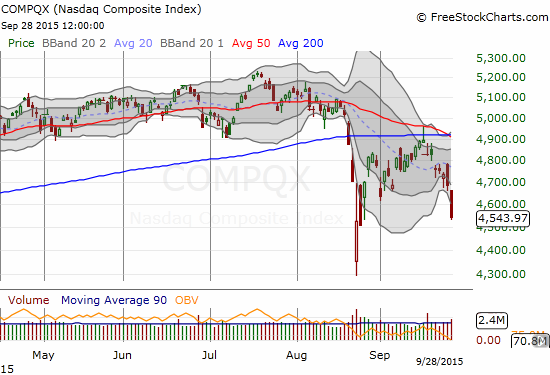
The story for the NASDAQ was once again the on-going selling pressure that has descended upon the iShares Nasdaq Biotechnology ETF (IBB). Trading volume hit a new record as an all-out selling panic is underway. Following the strategy I have outlined in prior pieces (you can start with “Hillary Clinton Takes Down the iShares Nasdaq Biotechnology: Buy the News?“), I added one last tranche of call options. While I am sticking to trading rules, my emotions tell me things do NOT look promising from here. Options offer the great advantage of a tight constraint on losses: I do not go to bed in fear of a huge gap down and remain focused on the tremendous upside I expect once IBB recovers from “the Clinton Bash.”

Needless to say, the push well below the lower-BB combined with the record trading volume makes IBB extremely oversold. This is rubber band time – whenever the fever breaks the snap back should/could be just as sharp as the current seller.
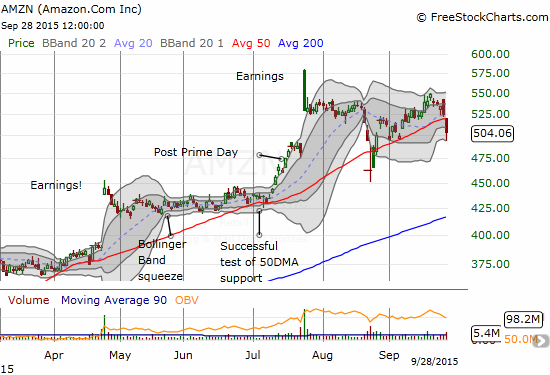
The selling pressure in tech was even strong enough to send Amazon.com (AMZN) below its 50DMA pivot again. I decided to put in a lowball offer on call options: it was filled well before the temporary break of the $500 mark.
No surprise then that the volatility index has jumped again. It jumped 17% on the day and closed right where the last surge began. An ominous sign no doubt.
There are a LOT of reasons to hate this market at this point. However, fear is not allowed in my basket of emotions, especially when fear seems to be at an extreme based on several technical and sentiment measures.
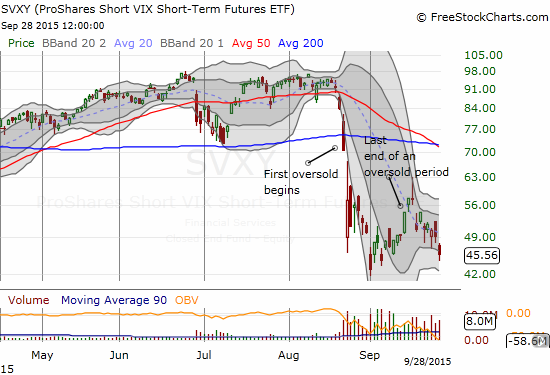
As usual, I am sticking with the T2108 trading rules, so I have re-activated oversold trading rules. As usual, I am taking the aggressive strategy and started right away with fresh trading shares in ProShares Short VIX Short-Term Futures (SVXY) and launched into call options on ProShares Ultra S&P500 (SSO). I usually pick an an expiration two Fridays away. I chose three Fridays this time as I can see this “Phase 3” of oversold trading dragging out before the last vestiges of fear and panic shake out.
I will not likely add any more T2108 trades unless I see the VIX surge. Something like the 90% surge (at its height) like the day of the flash crash would be ideal, but I cannot imagine a stampede like that happening again so soon. But of course, these are tense times so anything is possible. For now, I am targeting the next buy if (when?) the VIX gets within about 25% of the last high (around 49). This level happens to coincide with the 2010 and 2011 highs on the VIX. If the VIX manages to stay more controlled, then 1820 on the S&P 500 provides a reasonable second target for T2108 oversold trades.
With such a lofty final target for the VIX, I was not as aggressive as usual in releasing my hedges. Granted, part of the reason is that I go into this oversold period underweighted in my typical hedges.
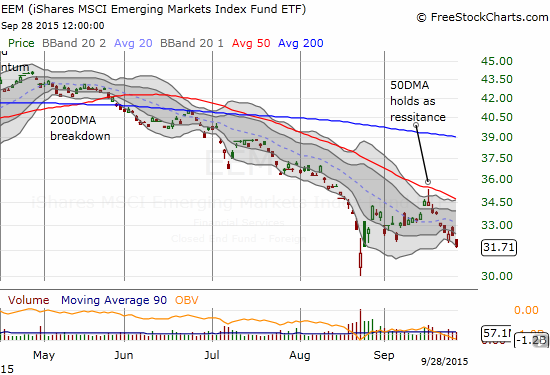
My positions in iShares MSCI Emerging Markets (EEM) are important hedges I am keeping close at hand. The news of the tremendous implosion in Glencore, the world’s commodity giant, was a tremendous warning for all things commodity and commodity-related…a warning hopefully none of my readers are hearing or seeing for the first time. Potential danger to major financial institutions is apparently now a new twist. (Do we finally see shadows of a Black Swan sneaking from behind?!?)
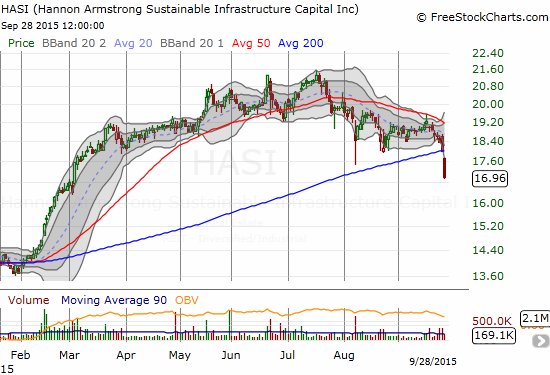
As the on-going collapse of commodities plays out, it sometimes erupts into fits of selling throughout ALL energy-related plays as fear spreads of imploding demand. Hannon Armstrong Sustainable Infrastructure Capital, Inc. (HASI) has been resilient…until now. HASI is a high-yielder that is heavily invested in alternative energy plays. I warned a friend last month that the sudden plunge on August 7th was a warning sign and confirmed the earlier 50DMA breakdown. Today’s much delayed follow-through could not be more emphatic. While volume did not match August’s plunge, the 5.7% loss that led to a clean break through 200DMA support was dramatic enough.
So, while I am sticking by the bullish thesis and even looking at the collapse of IBB as a buying opportunity, I am by no means blind to the real dangers the market presents.
Source: Unknown (found it on StockTwits)
BE CAREFUL OUT THERE!
Daily T2108 vs the S&P 500
")
Black line: T2108 (measured on the right); Green line: S&P 500 (for comparative purposes)
Red line: T2108 Overbought (70%); Blue line: T2108 Oversold (20%)
Weekly T2108

*All charts created using freestockcharts.com unless otherwise stated
The charts above are the my LATEST updates independent of the date of this given T2108 post. For my latest T2108 post click here.
Related links:
The T2108 Resource Page
Expanded daily chart of T2108 versus the S&P 500
Expanded weekly chart of T2108
Be careful out there!
Full disclosure: long SVXY shares, long SSO shares and call options, long UVXY put options, long IBB call options, long EEM call and put options, long AMZN call options