
(T2108 measures the percentage of stocks trading above their respective 40-day moving averages [DMAs]. It helps to identify extremes in market sentiment that are likely to reverse. To learn more about it, see my T2108 Resource Page. You can follow real-time T2108 commentary on twitter using the #T2108 hashtag. T2108-related trades and other trades are occasionally posted on twitter using the #120trade hashtag. T2107 measures the percentage of stocks trading above their respective 200DMAs)
T2108 Status: 22.4%
T2107 Status: 21.0%
VIX Status: 22.4
General (Short-term) Trading Call: Bullish
Active T2108 periods: Day #6 over 20%, Day #3 under 30% (underperiod), Day #25 under 40%, Day #85 under 50%, Day #102 under 60%, Day #307 under 70%
Reference Charts (click for view of last 6 months from Stockcharts.com):
S&P 500 or SPY
SDS (ProShares UltraShort S&P500)
U.S. Dollar Index (volatility index)
EEM (iShares MSCI Emerging Markets)
VIX (volatility index)
VXX (iPath S&P 500 VIX Short-Term Futures ETN)
EWG (iShares MSCI Germany Index Fund)
CAT (Caterpillar).
Commentary
In the last T2108 Update I delivered a healthy dose of sober observation tempered with rays of optimism. On Monday, I was encouraged to see my speculations play out: the S&P 500 rallied in an attempt to reverse Friday’s “strange” selling on the S&P 500 and volatility reversed. However, buyers could not retain the upper hand into the close. Today (September 22) sellers continued where they left off by pressing the S&P 500 (SPY) further below the breakdown point from a wedge pattern. Bob Pisani said on CNBC this was another of those “why are we down days?!?” – he succinctly expressed my exact sentiments.

The selling was ALMOST strong enough to push T2108 back into oversold territory. The low on the day was a tantalizing 20.4% before T2108 closed at 22.5%. Since I was primed to look for buying opportunities, I actually took this opportunity to add to my fade of ProShares Ultra VIX Short-Term Futures (UVXY) with put options. I was not expecting a return to oversold territory this soon, and I continue to trade assuming T2108 will avoid a close below 20%. If T2108 drops into oversold territory anyway, I will trade it just as aggressively as I did during the previous oversold periods. The main difference between now and then is that I will have very few bearish positions on hand going into a new oversold period.
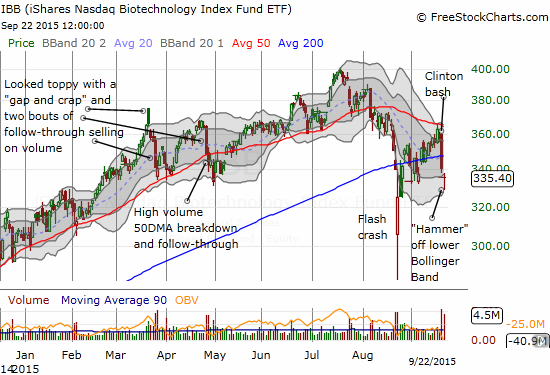
I was primed to buy on the day because of a strategy I laid out the previous day to fade Presidential candidate Hillary Clinton’s plan to go after pricing in the drug industry. (Thank you to MarketWatch for catching my piece!) The plan has played out well so far as I managed to get a fill on a lowball limit order for iShares Nasdaq Biotechnology (IBB) call options near the low of the day. The rally off the bottom delivered over a 33% gain on the call options. I am still targeting a complete reversal of the Clinton-inspired sell-off.
I just made my buy. =gulp= Hillary Clinton Takes Down the iShares Nasdaq Biotechnology http://stks.co/j3A4r (complicated by mkt sell-off)
— Duru A (@DrDuru) Sep. 22 at 09:51 AM
I also turned my attention to the iShares MSCI Emerging Markets (EEM). EEM gapped down and closed with a 1.9% loss on the day. This marked a great spot for resetting one of my favorite trades: the EEM strangle – a long combination of out-of-the-money call and put options. I am more weighted toward the put options which expire after the call options. If the market endures a fresh phase of selling, EEM should get hit particularly hard again.

Google (GOOG) finally pulled back to the 50DMA pivot, but I may run out of time to profit. I started into my weekly options last Friday. Today’s drop below the pivot was exactly opposite the strong bounce I wanted to see.

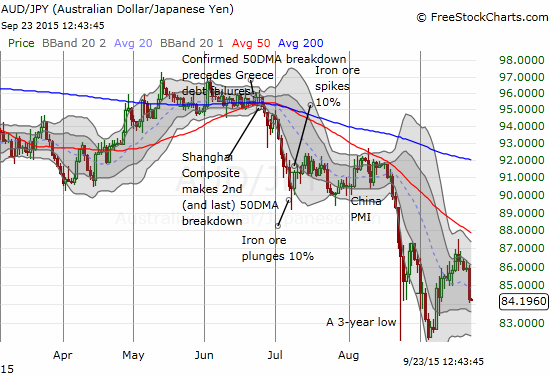
I am still warily eyeing the Australian dollar (FXA) versus the Japanese yen (FXY). AUD/JPY plunged overnight in reaction to yet more poor manufacturing data from China. The move seems to confirm a top and increases the risk of further downside. I decided to go head and take my profits on my latest short AUD/JPY position.
In the spirit of this churning market, I present two contrasting market views.
First, the bearish view of Robert Shiller who has long warned of a large sell-off based on his specialized valuation metric. Shiller estimates a “fair value” of the S&P 500 around 1300. Shiller naturally caveats this catastrophic evaluation with a reminder that the market could always get even more over-valued from here. He even recommends that people should not over-react, but those who are “over-exposed” should reconsider their positions. Shiller has at least put SOME of his money where his mouth is by withdrawing a portion of his investments from the market. He ends the segment by saying “these are dangerous times.”
Apparently, Shiller has great company in this fear of the current times. Bloomberg recently produced a piece called “Who’s Left to Sell U.S. Stocks? Mood Darkens Most Since Volcker.” It featured some surprising data on the extremes of bearish sentiment in what Bloomberg (and others) call one of the most hated bull markets in history.
Key data points:
- Since 1963, the Standard & Poor’s 500 Index has advanced an average 11 percent in the year after newsletter writers surveyed by Investors Intelligence were as pessimistic as they are now, data compiled by Bloomberg show. That compares with an annualized return of 8.3 percent.
- Fear reigns, spreading faster than any time since 1984 as the S&P 500 tumbled 10 percent over four days in August. At the start of this month, the bull-to-bear ratio in Investors Intelligence’s survey of newsletter writers fell to a four-year low of 0.9. In April, when bulls dominated the market that was heading for an all-time high, the ratio reached 4.1.
- The cost of puts protecting against a 10 percent drop in the S&P 500 rose to a record on Aug. 24 relative to calls betting on a 10 percent rally, according to three-month data compiled by Bloomberg. While the spread has retreated to 12.76, it’s still up 30 percent from three months ago and higher than 99 percent of the time since 2005.
- In futures tracking the S&P 500, bearish contracts outnumber bullish ones by the most in three years, data from the Commodity Futures Trading Commission show.
- Speculators increased short positions in stocks to the highest level since March 2009, according to data compiled by U.S. exchanges.
- Bearish newsletter writers surpassed bullish ones three other times during the last 6 1/2 years, in April 2009, August 2010 and October 2011. All turned out to be buying opportunities as the S&P 500 rallied for two straight quarters each time, with gains exceeding 20 percent.
These data do NOT characterize a complacent market! The “Shiller fear” seems well-established and deeply entrenched in the market. I will of course continue to pick the side of T2108. Sitting at or near oversold territory is quite consistent with market fear and the attractiveness of trading like a contrarian.
Daily T2108 vs the S&P 500
")
Black line: T2108 (measured on the right); Green line: S&P 500 (for comparative purposes)
Red line: T2108 Overbought (70%); Blue line: T2108 Oversold (20%)
Weekly T2108

*All charts created using freestockcharts.com unless otherwise stated
The charts above are the my LATEST updates independent of the date of this given T2108 post. For my latest T2108 post click here.
Related links:
The T2108 Resource Page
Expanded daily chart of T2108 versus the S&P 500
Expanded weekly chart of T2108
Be careful out there!
Full disclosure: long SVXY shares, long SSO shares, long CAT puts, short AUD/JPY, long AAPL put spread