
(T2108 measures the percentage of stocks trading above their respective 40-day moving averages [DMAs]. It helps to identify extremes in market sentiment that are likely to reverse. To learn more about it, see my T2108 Resource Page. You can follow real-time T2108 commentary on twitter using the #T2108 hashtag. T2108-related trades and other trades are occasionally posted on twitter using the #120trade hashtag. T2107 measures the percentage of stocks trading above their respective 200DMAs)
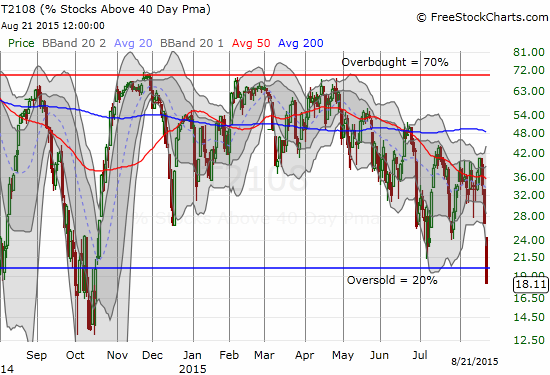
T2108 Status: 18.1% (an 8.7 drop translating into a loss of 32%!!!!)
T2107 Status: 25.5%
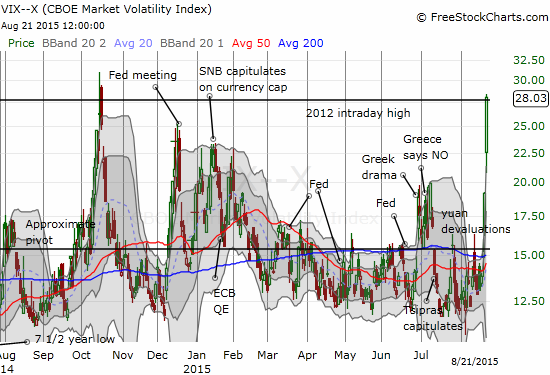
VIX Status: 28.0
General (Short-term) Trading Call: Bullish
Active T2108 periods: Day #1 below 20% (Day #1 oversold ends an incredible 209 days OVER 20%, that is, avoiding oversold conditions), Day #2 under 30%, Day #25 under 40%, Day #65 under 50%, Day #82 under 60%, Day #281 under 70%
Reference Charts (click for view of last 6 months from Stockcharts.com):
S&P 500 or SPY
SDS (ProShares UltraShort S&P500)
U.S. Dollar Index (volatility index)
EEM (iShares MSCI Emerging Markets)
VIX (volatility index)
VXX (iPath S&P 500 VIX Short-Term Futures ETN)
EWG (iShares MSCI Germany Index Fund)
CAT (Caterpillar).
Commentary
$GOOG at new post-earnings low. As @TraderMike would say… "It's raining stocks!"
— Dr. Duru (@DrDuru) August 21, 2015
FINALLY!
After 209 straight days of trading above oversold conditions, my favorite technical indicator, T2108, has finally dropped into oversold conditions. And boy was this one epic of a plunge below the 20% threshold. The severity of the sell-off felt like it could rival any market crash. Everywhere I look, I see extremes of movement and placement.
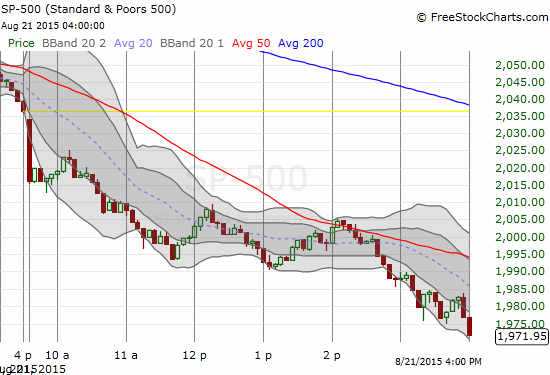
T2108 fell all the way from 26.8% to today’s 18.1%, a massive one-day loss of 32%. The last time T2108 lost this much in one day was June 20, 2013 when T2108 lost 39.5% on its way to a rendezvous with oversold conditions. The 2-day loss of 46.9% was last achieved on August 1, 2014. It ranks as the 30th largest 2-day loss for T2108 since 1986.
The roundtrip between oversold conditions has left the S&P 500 (SPY) with a gain of 4.5%. That is, if you followed the conservative T2108 buying strategy of waiting for T2108 to exit oversold conditions, you would be sitting on a 4.5% gain right now as you waited 210 days for the next oversold period. For context, here is a chart that should be familiar to regular readers (index to 209 days).
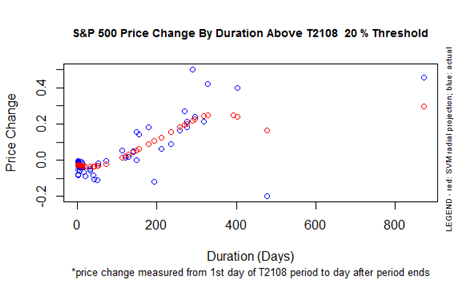
The chart above uses the blue dots to measure the S&P 500’s performance from the first day over 20% to the first day under 20% again. These are the days for the 20% overperiod that are known – you can never know the exact day the overperiod will come to an end. The red dots represent projections using a machine learning algorithm (called SVM – Support Vector Machine). In this case, not knowing the exact day cost another 3.2 percentage points of performance, almost half of the gain since the last oversold period ended. That change is pretty dramatic: one day slashes the performance built over 10 months of trading. Also note that the S&P 500 severely underperformed the model’s projected gain of 12% for a 20% overperiod that lasted as long as this one did. This underperformance highlights and reconfirms the deteriorating nature of this market.
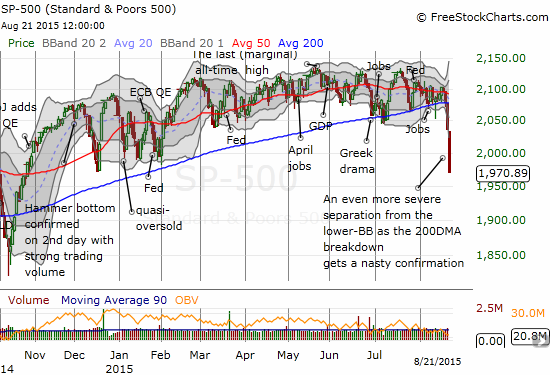
Most remarkably, the entire length of the S&P 500’s loss occurred BELOW its lower-Bollinger Band (BB). This is a severe breakdown and over-extended stretch. I cannot even remember the last time the S&P 500 has closed in such a severe manner – perhaps during the financial crisis?
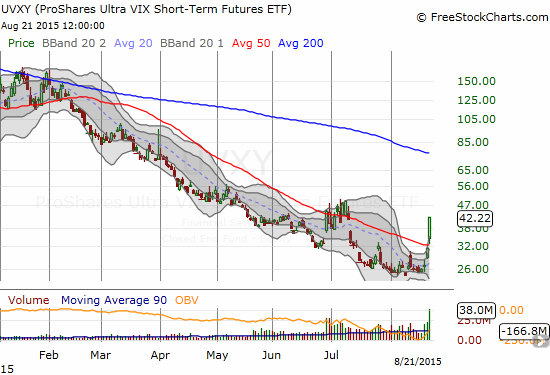
Appropriately, the volatility index also put on a show. The VIX surged an incredible 46.4% to 28.0. Coincidentally (?) this is the same level where the VIX peaked on an intraday basis back in 2012. The VIX fell short of the peak from last October’s oversold period.
This collection of severe ugliness is EXACTLY what I want for an oversold period. The only thing missing from the ideal scenario I described in the last T2108 update is a sharp same-day bounce back toward the lower-BB. I thought the bounce was coming on schedule after the morning’s early selling.
Never a good sign when initial bounce off a gap down is followed by selling to new lows. Likely need at least another whoosh downward. $SPY
— Dr. Duru (@DrDuru) August 21, 2015
On the positive side, the market’s on-going selling gave me ample time to execute my T2108 trading plans for the day. I had time to review, consider, and think – a rarity in the face of panic. Here is a summary of what I did to position myself for the bounce out of oversold conditions (it was a LOT more trading than I like to do, but the opportunities were so plentiful)…
- The market gapped down for a fraction of a loss but already some of my bearish positions had become very profitable. I quickly closed out three of the five short positions that I closed on the day. I did not close everything at once because T2108 was not yet oversold. The T2108 rule on bearish positions is to close out most if not all once the market goes oversold.
- Not wanting to miss a potential bounce from “close enough” oversold conditions, I quickly moved to a first tranche of buys: Apple (AAPL) call options, added to my ProShares Ultra S&P500 (SSO) call options, and added another ProShares Ultra VIX Short-Term Futures (UVXY) put option. It turned out all these moves were too early, but they were calculated risks.
- I next moved on to the stocks that were on the top of my buy list: Workday (WDAY) call options (earnings are coming – gulp!), Canadian Solar (CSIQ) – “ridiculously” oversold now, Netflix (NFLX) – on the list of aggressive buys, SSO call options – I put in what I thought was a “low ball” offer, but it filled less than two hours later when T2108 flipped oversold.
- I later moved on to more speculative plays: Disney (DIS) – added to short-term call options; iShares Nasdaq Biotechnology (IBB) – every time I think biotech is finally going to experience a long overdue STEEP correction, it comes right back. I am speculating these call options benefit from a fresh resurrection; SanDisk (SNDK) – I liked the way it rallied strongly off its lows from a deeply oversold position. I bought shares in anticipation of a rocky ride upward. Unfortunately, SNDK closed the day at a new low, so I may get stopped out soon.
- The final phase of my trading came in the final 90 minutes as it became clear that the market was unlikely to deliver any kind of bounce. I covered two more bearish positions into the rolling panic. I am now left with little “backside protection,” and feel quite naked. However, this is part of the discomfort I EXPECT during an oversold period. I marveled at the surge in volatility. After wiping the disbelief from my eyes, I bought a very aggressive UVXY put option. (If volatility goes even higher, I will next need to look for put options to SELL). I moved to buy new call options against Facebook (FB) as a part of my on-going strategy to trade around my core short position. Finally, I could not help but speculate one last time on AAPL call options wit the stock barreling well below its lower-BB. I am still holding onto my put spread on AAPL. Tim Cook better get busy soon using his billions to load up on more AAPL shares!
- For good measure, right before the close and in the middle of the heat of the panic, I bought SHARES of SSO and ProShares Short VIX Short-Term Futures (SVXY). I will be riding these out as long as possible as a more extended play on a bounce from oversold conditions. If I add to anything during the oversold period, I will start with these shares. As a T2108 rule for aggressive trades, it only makes sense to accumulate when volatility surges to new heights. For example, if the VIX breaks the highs from the last oversold period (October, 2014), I will automatically trigger more buys.
I detailed my trading to provide a timely example of a trading plan in execution. Sticking to trading rules becomes all the MORE important during periods like this one. Traders cannot allow the pain of the selling to become a distraction from the knowledge and appreciation that the selling is extreme and the oversold period WILL end at some point. Of course, if you came into this oversold period as a long suffering bear, you were celebrating and thumping your chest (enjoy it while you can!).
The selling was so vicious on Friday that my few bearish positions were more than enough to make up for losses on bullish positions. Limited downside and tremendous upside potential is part of the benefit of trading options. It was a pleasant surprise to come out of the day with a nice gain. This gain will help buffer my trading for however it long it takes the market to chop through this oversold period.
The big caveat to the T2108 trading strategy is that we cannot know the sustainability or the duration of the rally that comes afterward. I have calculated averages and medians for guidance to use along with standard technical observations (see my posts on explaining T2108 for related charts). For example, I think the damage to the stock market is SO brutal that the most we can expect out of the next bounce on the S&P 500 is a retest of the 200DMA as resistance. Such a retest is not likely to happen anytime soon given what I have noted in this and other posts as the deteriorating underpinnings of this market. In other words, we should all brace for things to get a lot worse before they get better (and they WILL get better!). To make it plain, do NOT expect the end of this oversold period to mark a sustainable bottom for the market. As always, I will take this one step at a time; I am not ready to recommend fading rallies after coming out of this oversold period.
The Federal Reserve is the BIG wildcard to all this drama. We are unfortunately these days bound psychologically, technically, and fundamentally to the globe’s central banks with the Fed in the center of it all. I suspect adding to the fear in the market is a sense the Fed is on a determined course to hike rates this year no matter what happens. I think this is a misplaced fear. The Fed remains trapped by the market. I FULLY expect the Fed to cry uncle and admit that it cannot start a normalization cycle under current conditions. The Fed’s worst fear is doing something that cuts this fragile recovery at the knees. So even IF the Fed hikes rates anyway, it should go out of its way to reassure the market that it sees no reason to hike rates again anytime soon. The rate hike will become a token symbol of the Fed’s willingness to restart normalization “someday.” For reference, just witness how the Bank of England was forced to stand down from its insistence last summer that rates would go higher sooner than the market expected. The market won that contest too.
I have written so much now, I cannot possibly do the DOZENS of chart reviews I would love to do here. Almost everywhere you look, you will find stocks severely oversold, as they trade well below support levels and well beyond “normal” ranges. Opportunity abounds in times like these if you are willing to stay flexible, pay attention, and filter appropriately.
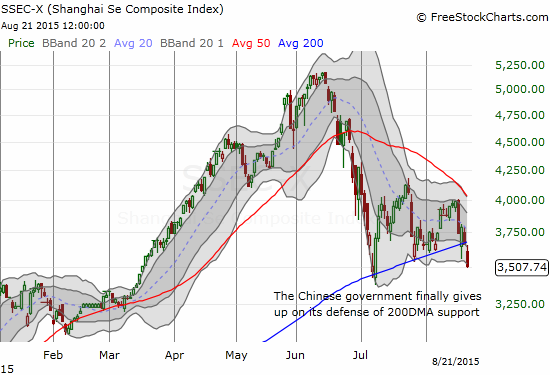
The Shanghai Composite exemplifies the rush to the exits. The index got the global selling started with a long overdue breakdown below its 200DMA. It looks like the Chinese government has finally stopped its defense of this critical support. Is it now willing to let the market fall to where it “wants” to go?
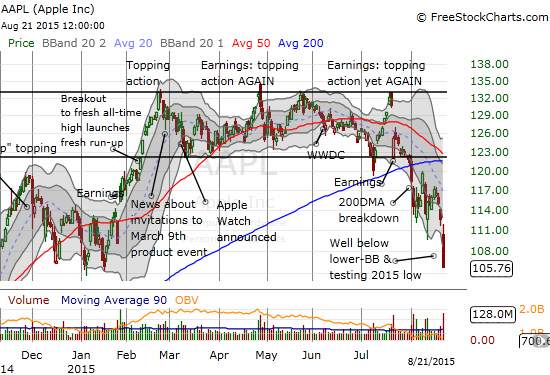
Apple (AAPL) looks primed for a bounce. AAPL is just as much, if not MORE, oversold than it was when I wrote “Apple Finally Flips To Oversold” on July 9th. AAPL bounced sharply and profitably from there. Earnings also rudely interrupted the nice bounce. AAPL has not been the same since. The current oversold position has taken AAPL right to its low of the year. I do not think I need to write an entire post to explain how or why going long is the best risk/reward (short-term) trade from here. A first upside target could simply be a reversal of Friday’s massive 6.1% loss.
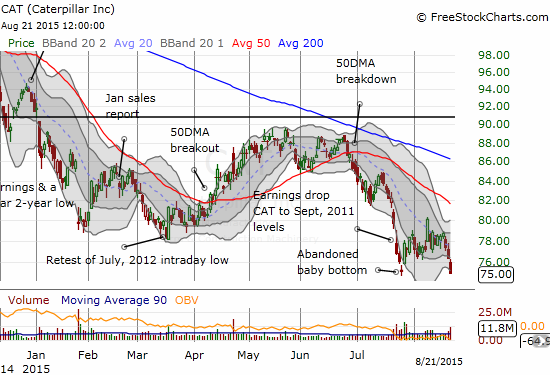
Caterpillar (CAT) is not quite as oversold as I would like. The stock looks like it could EASILY sell-off again past what should have been a firm bottom. I will interpret such a violation of the previous bottom as a bearish event. I am watching CAT even more closely than usual. It will be the first stock I FADE coming out of the oversold period. As a reminder, CAT is one of my favorite on-going hedges against bullish positions in the stock market.
Daily T2108 vs the S&P 500
")
Black line: T2108 (measured on the right); Green line: S&P 500 (for comparative purposes)
Red line: T2108 Overbought (70%); Blue line: T2108 Oversold (20%)
Weekly T2108

*All charts created using freestockcharts.com unless otherwise stated
The charts above are the my LATEST updates independent of the date of this given T2108 post. For my latest T2108 post click here.
Related links:
The T2108 Resource Page
Expanded daily chart of T2108 versus the S&P 500
Expanded weekly chart of T2108
Be careful out there!
Full disclosure: positions described above
Duru,
Great commentary, as usual. Too bad we weren’t ready this morning when the VIX went banannas and many stocks were being ‘given’ away. But it didn’t last long, just a few minutes….pity.
A 2008/2009 meltdown for no good reason, at least that I can see.
But I particularly love one comment you made: Wowza! I think that captures it.
Tomorrow will be interesting.
See my latest post. I was specifically ready! 🙂 http://drduru.com/onetwentytwo/2015/08/25/t2108-update-150824/