
(T2108 measures the percentage of stocks trading above their respective 40-day moving averages [DMAs]. It helps to identify extremes in market sentiment that are likely to reverse. To learn more about it, see my T2108 Resource Page. You can follow real-time T2108 commentary on twitter using the #T2108 hashtag. T2108-related trades and other trades are occasionally posted on twitter using the #120trade hashtag. T2107 measures the percentage of stocks trading above their respective 200DMAs)
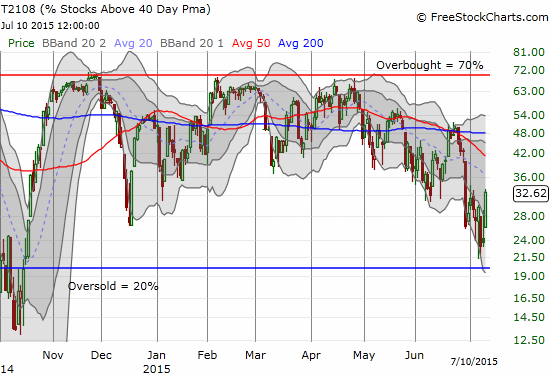
T2108 Status: 32.6% (the 9 percentage point increase is a 38% increase)
T2107 Status: 40.5%
VIX Status: 16.8
General (Short-term) Trading Call: Bullish
Active T2108 periods: Day #181 over 20%, Day #1 over 30% (overperiod, ends 5 days under 30%), Day #8 under 40%, Day #34 under 50%, Day #51 under 60%, Day #250 under 70%
Reference Charts (click for view of last 6 months from Stockcharts.com):
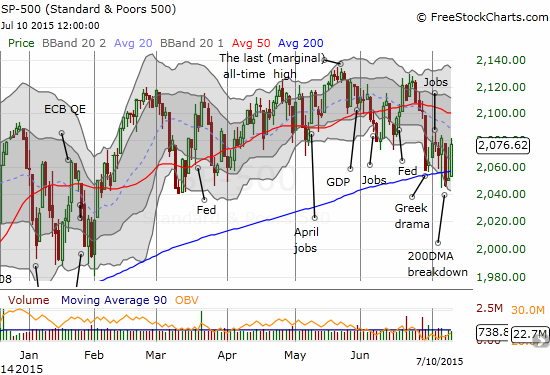
S&P 500 or SPY
SDS (ProShares UltraShort S&P500)
U.S. Dollar Index (volatility index)
EEM (iShares MSCI Emerging Markets)
VIX (volatility index)
VXX (iPath S&P 500 VIX Short-Term Futures ETN)
EWG (iShares MSCI Germany Index Fund)
CAT (Caterpillar).
Commentary
T2108 ended the week with a tremendous and encouraging surge. This is the kind of move that typically signals the end of an oversold period or, in this case, the test of oversold conditions.
T2108’s surge has set up a bullish divergence with the S&P 500 (SPY). The index’s 1.2% gain once again confirmed its 200DMA as support, but the close is NOT the highest close since the Greek debt drama set up the first 200DMA test on June 29th.
The volatility index, the VIX, remains elevated above the 15.35 pivot. Its close on Friday, July 10th, is only the third lowest close since June 29th. I cannot “ring the bell” for an all-clear until the VIX has closed below the pivot line.
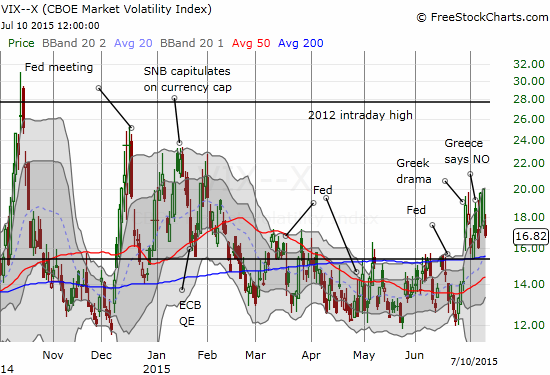
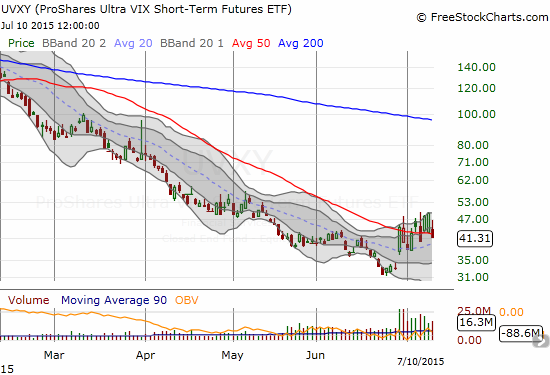
Given the persistent danger and risk, I decided to refine my approach to the current T2108 trade to fade volatility. I bought a small number of ProShares Ultra VIX Short-Term Futures ETF (UVXY) at its 50DMA as a small hedge against my put options. This move is also consistent with a plan I discussed in earlier posts to get more bearish if the VIX managed to close at a new high for this current cycle. On Thursday, July 9th, the VIX just BARELY managed to close at a fresh high at 20. The intra-day high was 19.8. The market did not deliver follow-through, so I cannot technically get more bearish, but it makes sense to finally start hedging more.
My plan is to sell the UVXY shares on it next spike higher. If I had followed this strategy earlier, I would have paid for my put options and then some by now. My most profitable (and desired) outcome remains a continued plunge in volatility.
I am also monitoring the Australian dollar (FXA) versus the Japanese yen (FXY) more closely. It has been a very good gauge of risk aversion during this period of angst. The week ended with dramatic churn in the price of iron ore. On Wednesday it plunged 10% and then on Thursday soared 10%. I will have more to write on the fundamentals in a future piece. Suffice to say for now that until iron ore makes a new low, traders should assume the spike ends the latest bearish move in iron ore. As long as iron ore stays off the recent multi-year low (going back to at least 2005!), traders will have reason to get at least marginally more bullish on the entire “China complex” (and China is the much more important sentimental and fundamental factor weighing on markets than Greece). AUD/JPY now looks like it has bottomed for now.
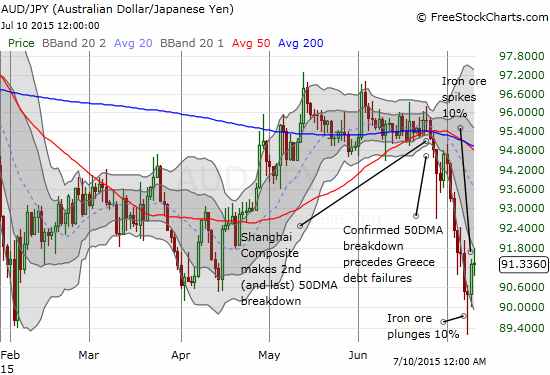
The Australian dollar is of course not out of the woods by a longshot. In line with my hedge on UVXY, I have begun to short AUD/JPY as a currency hedge. AUD/JPY has a LOT of work to do to get above its critical 50 and 200DMAs.
Finally, the most gratifying trade from Friday was Apple (AAPL). In “Apple Finally Flips To Oversold” I explained why I thought AAPL (AAPL) was due for a bounce. AAPL delivered big time with a huge gap up that received follow-through buying. AAPL managed to close near its high for the day.
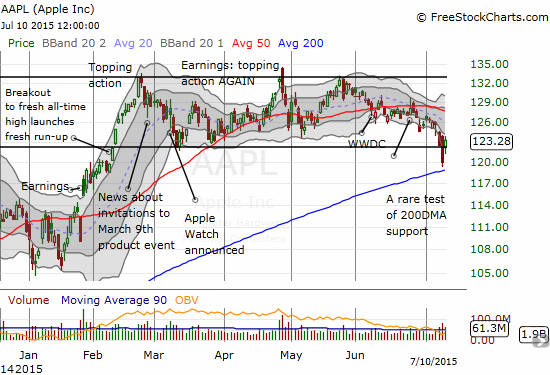
I sold a portion of my call options to take some profit. I am going to try to ride out the remainder through the coming week. Note well that AAPL still has work to do to break the current short-term downtrend as partially defined by its now declining 20DMA. The 50DMA is also starting to decline.
Daily T2108 vs the S&P 500
")
Black line: T2108 (measured on the right); Green line: S&P 500 (for comparative purposes)
Red line: T2108 Overbought (70%); Blue line: T2108 Oversold (20%)
Weekly T2108

*All charts created using freestockcharts.com unless otherwise stated
The charts above are the my LATEST updates independent of the date of this given T2108 post. For my latest T2108 post click here.
Related links:
The T2108 Resource Page
Expanded daily chart of T2108 versus the S&P 500
Expanded weekly chart of T2108
Be careful out there!
Full disclosure: net short the euro, long UVXY put options, long USO call options