
(T2108 measures the percentage of stocks trading above their respective 40-day moving averages [DMAs]. It helps to identify extremes in market sentiment that are likely to reverse. To learn more about it, see my T2108 Resource Page. You can follow real-time T2108 commentary on twitter using the #T2108 hashtag. T2108-related trades and other trades are occasionally posted on twitter using the #120trade hashtag. T2107 measures the percentage of stocks trading above their respective 200DMAs)
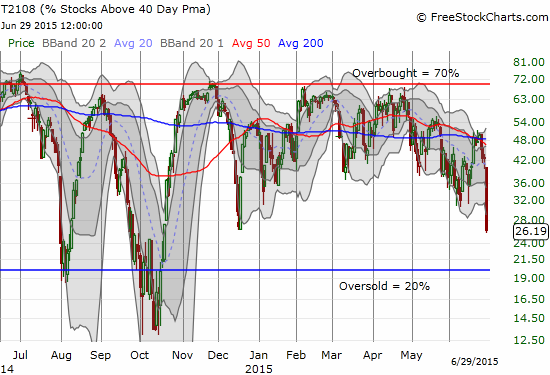
T2108 Status: 26.1% (a 38.4% plunge! 16 percentage points!)
T2107 Status: 40.2%
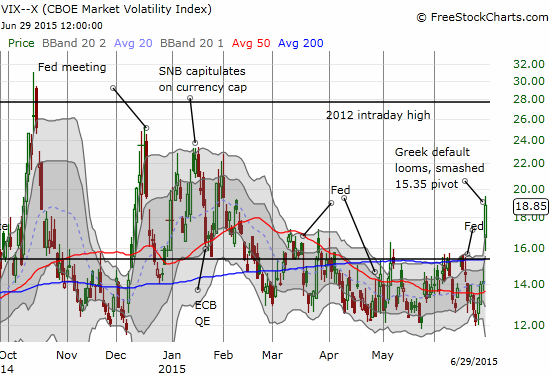
VIX Status: 18.9 (up 34%!)
General (Short-term) Trading Call: Bullish
Active T2108 periods: Day #174 over 20%, Day #1 under 30% and 40% (underperiods) ending 132 days above 30% and 8 days above 40%), Day #27 under 50%, Day #44 under 60%, Day #243 under 70%
Reference Charts (click for view of last 6 months from Stockcharts.com):
S&P 500 or SPY
SDS (ProShares UltraShort S&P500)
U.S. Dollar Index (volatility index)
EEM (iShares MSCI Emerging Markets)
VIX (volatility index)
VXX (iPath S&P 500 VIX Short-Term Futures ETN)
EWG (iShares MSCI Germany Index Fund)
CAT (Caterpillar).
Commentary
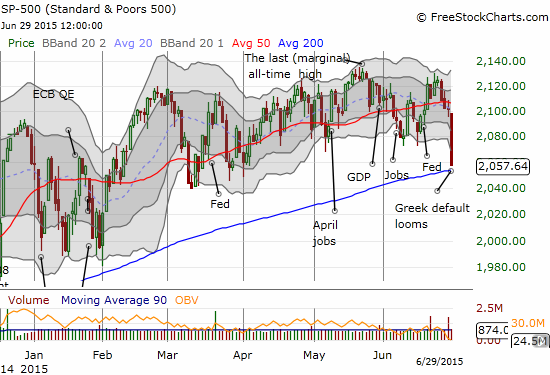
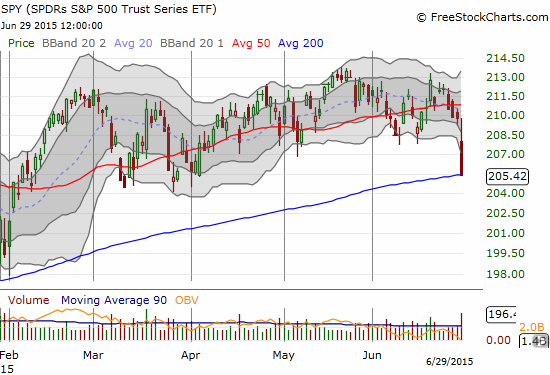
T2108 closed at 26.2%, its lowest close since the rebound from last October’s big oversold swoon. It is very tempting to declare the market “close enough” to the oversold threshold of 20%. However, all the chop during this year has flattened moving averages which in turn means T2108 can cover a lot of ground with the right kind of trading power. The market received just such a push today. The surge in trading volume is clear on the chart of SPY: sellers drowned the sea in red with double the average! It was quite a combination of trading on the day with the S&P 500 (and SPY) barreling toward and into 200DMA support, T2108 crumbling a massive 16 percentage points (a drop of 39%), and the VIX soaring 34%.
The trading action in currency markets motivated me to trade as if T2108 is already oversold. Even as the S&P 500 continued to slip all day and volatility expanded, the euro (FXE) – centerpoint of the Greek drama receiving the blame for the market’s troubles – remarkably gained strength. The euro not only quickly reversed its gap down, the roiling currency surged well past the gap. Either the market is looking forward to Greece’s exit from the euro, or market participants are assuming that central banks and governmental authorities will now be forced to provide a “solution” quick, fast, and in a hurry…
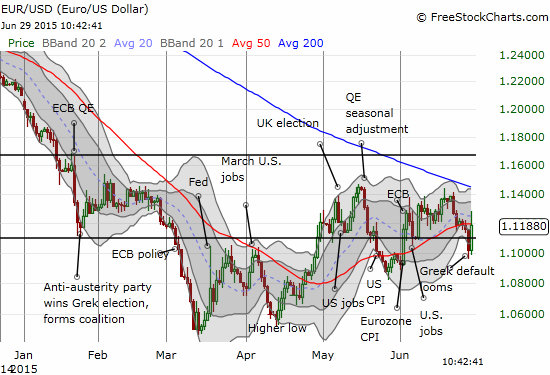
In times of panic, the opposite trade often prevails. So, I closed out my short on EUR/USD soon after the open on Sunday. I rebuilt that short into the resurgence in preparation for the next swoon from dramatic headlines. I plan to accumulate further up to previous resistance around 1.14. There is ultimately no good outcome from Greece short of the generosity of a restructuring of debt.
The euro’s resilience initially seemed to explain the immediate bounce on the S&P 500 at the open. The divergence from there was quite remarkable and surprising.
So far, lots of #Grexit bluster, little bite. Sure $GREK down 15% but $EURUSD almost fully recovered gap down. $SPY down just 0.6% #forex
— Dr. Duru (@DrDuru) June 29, 2015
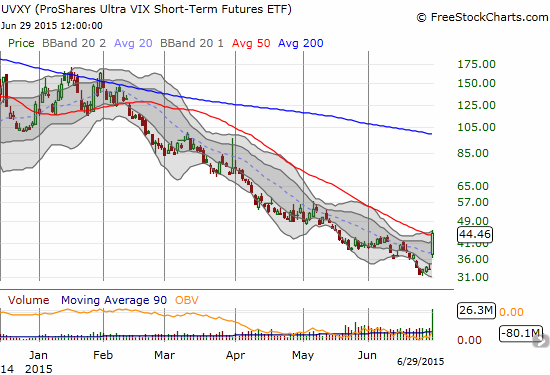
I grabbed the usual suspects for the oversold trade. I first bought put options on ProShares Ultra VIX Short-Term Futures ETF. I next bought my first tranche of call options on SSO.
%sotcks>40DMA back to 33%. Around recent lows. Starting with fade of $UVXY. $SSO next after that. #122trade #T2108
— Dr. Duru (@DrDuru) June 29, 2015
For good measure, I added a few short positions on high-flyers like Tesla (TSLA) which are sure to tumble far and fast if the market sell-off really gets ugly. I also faded the rise in Ambarella (AMBA); the stock surprisingly went GREEN for a spell before fading into a -0.75% close (see the last T2108 update for a description of the setup). In other trades, I pulled the trigger on trading range/pivots the United States Oil ETF (USO) for a second to time and on Apple (AAPL).
With a holiday-shortened week in the U.S. that will include the release of the June jobs report, I am expecting the market to experience rapidfire movements, especially in currency markets. Most of my focus will be on monitoring the currency markets and trading accordingly. In the meantime, I will need a major reversal in volatility within the next 2 1/2 weeks to get good on my UVXY and SSO trades.
Daily T2108 vs the S&P 500
")
Black line: T2108 (measured on the right); Green line: S&P 500 (for comparative purposes)
Red line: T2108 Overbought (70%); Blue line: T2108 Oversold (20%)
Weekly T2108

*All charts created using freestockcharts.com unless otherwise stated
The T2108 Resource Page
Expanded daily chart of T2108 versus the S&P 500
Expanded weekly chart of T2108
Be careful out there!
Full disclosure: long SSO calls, long UVXY puts, short EUR/USD