
(T2108 measures the percentage of stocks trading above their respective 40-day moving averages [DMAs]. It helps to identify extremes in market sentiment that are likely to reverse. To learn more about it, see my T2108 Resource Page. You can follow real-time T2108 commentary on twitter using the #T2108 hashtag. T2108-related trades and other trades are occasionally posted on twitter using the #120trade hashtag. T2107 measures the percentage of stocks trading above their respective 200DMAs)
T2108 Status: 42.6%
T2107 Status: 46.4%
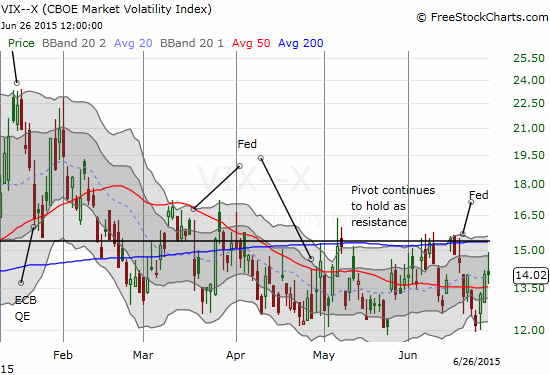
VIX Status: 14.0
General (Short-term) Trading Call: Neutral
Active T2108 periods: Day #173 over 20%, Day #132 above 30%, Day #8 over 40% (overperiod), Day #26 under 50% (underperiod), Day #43 under 60%, Day #242 under 70%
Reference Charts (click for view of last 6 months from Stockcharts.com):
S&P 500 or SPY
SDS (ProShares UltraShort S&P500)
U.S. Dollar Index (volatility index)
EEM (iShares MSCI Emerging Markets)
VIX (volatility index)
VXX (iPath S&P 500 VIX Short-Term Futures ETN)
EWG (iShares MSCI Germany Index Fund)
CAT (Caterpillar).
Commentary
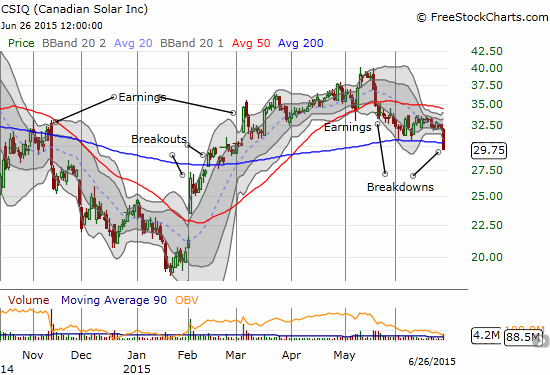
Hmm..I am starting to see more and more breakdowns. A signal? $CSIQ breaking 200DMA support. Confirms May's 50DMA breakdown.
— Dr. Duru (@DrDuru) June 26, 2015
Given that T2108 and T2107 closed essentially unchanged on Friday, the increase in breakdowns turned out to be more a function of where I happened to look on Friday, June 26, 2015.
However, one breakdown should now be on everyone’s radar. On Friday, the Shanghai Composite Index (SSEC-X) lost 7.4%. The selling confirmed a 50DMA breakdown and produced a fresh 6-week low. The index is now down 19% from a major multi-year high set just two weeks ago. The index is STILL up 34% year-to-date.
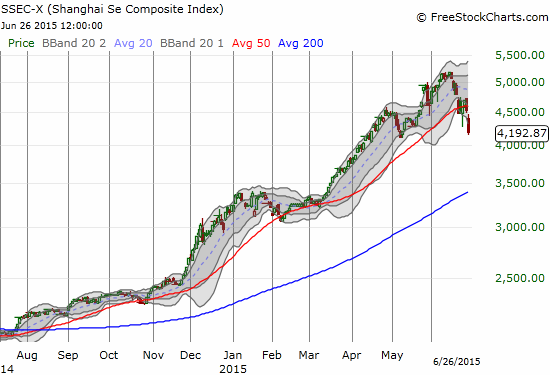
The Shanghai Composite Index is China’s casino stock market. We have heard stories for months now about the gold rush mentality among retail traders eager to open trading accounts to get in on the action. The tremendous rush of what has reportedly been thousands of new accounts a day has come despite a slowing growth rate in China and plunging prices of steel rebar to 2009 levels. The slump in steel is at least symbolic of a larger malaise as so much of the larger China story runs on infrastructure and construction – both heavy users of steel.
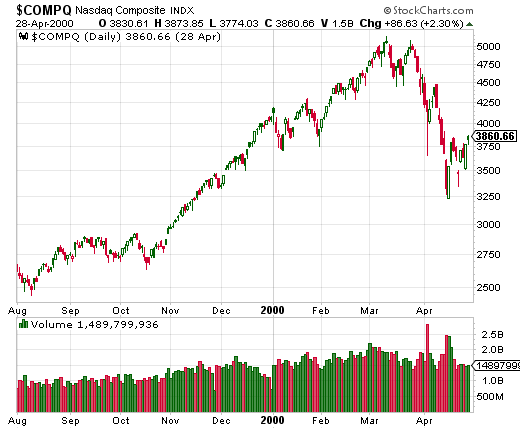
The current breakdown of the Shanghai Index represents a near inevitable end of the momentum. The similarities to the NASDAQ bubble and crash are also not surprising given these frenetic trading conditions and rapid, parabolic gains. China’s rush to cut interest rates to a record low on Saturday represents a desperate acknowledgement that conditions are potentially teetering on a bigger calamity. It is now the FOURTH rate cut since November. Along with everyone else, I will be looking to see whether this cut works to calm China’s stock traders.
Meanwhile, back on the home front, the S&P 500 (SPY) remains contently oblivious.
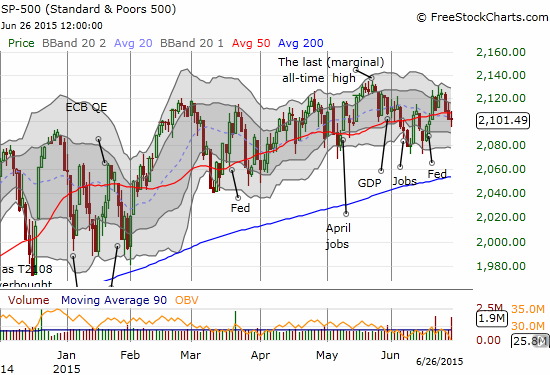
The VIX tried to generate some excitement but was promptly faded before it could reach the 15.35 pivot (now firm resistance).
The only thing preventing me from getting outright bearish on the U.S. market is that T2108 is stuck firmly in neutral territory. So, the trading call remains neutral, and I am still focused on stock-specific stories. To stick with a bearish theme, I present charts from the ugly side of the fence…
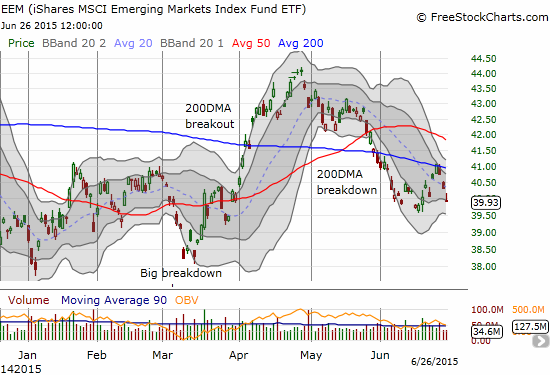
This chart on iShares MSCI Emerging Markets ETF (EEM) is “catch-up.” I should have noted it earlier. After EEM tested resistance at the 200DMA, I loaded up on put options. I closed them out on Friday. The difference between this trade and the past two is that I did not hedge with call options.
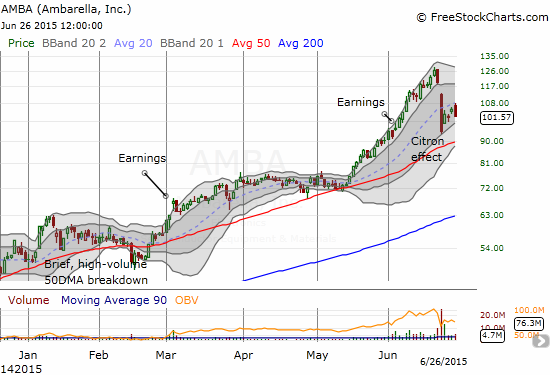
Ambarella, Inc. (AMBA) has been a momentum favorite for a while now. On Monday, June 22nd, notorious short-seller Citron brought an end to that momentum in dramatic style. Interestingly, Citron released its report on the morning of Friday, June 19th, but I guess it took the weekend for enough people to truly believe whatever the report said.
CItron comments on $AMBA ridiculousness. price target $60. Rev since IPO up 100% EV up 6,000%. Read full story http://t.co/RL3GQgd05g
— Citron Research (@CitronResearch) June 19, 2015
The lack of commitment to this stock showed in the subsequent rush to the exits – a classic characteristic of momentum stocks. After the dust settled, AMBA had lost 21%. The next day, it gapped up as the last bargain hunters and short-covering went to work. The momentum came to a fresh end with Friday’s bearish engulfing pattern. As ugly as the chart looks now, the stock is not technically confirmed as bearish until major support breaks, like the 50DMA.
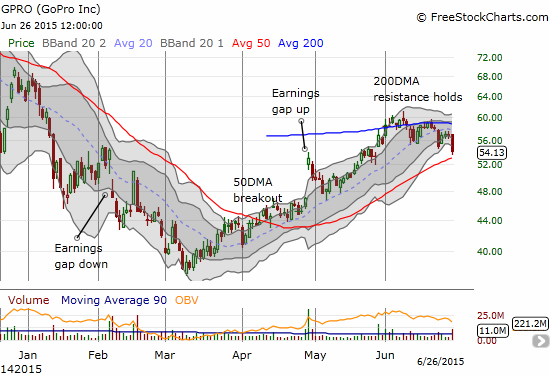
AMBA got a lot of its fame from being a supplier to GoPro, Inc. (GPRO). AMBA has performed much better than GPRO. AMBA has made numerous all-time highs and until last week experienced near non-stop, breakneck upward momentum. GPRO had its day and is now struggling to regain former glory. That excitement returned with earnings in April. After a complete reversal of the post-earnings gap that I SHOULD have bought, the stock resumed its recovery from the March low. The momentum has wavered in June as the 200DMA has held firm as resistance. AMBA put GPRO back on my radar and I promptly faded the weak recovery from Monday’s AMBA-sympathetic drop.
Again, I am not yet bearish on the stock market overall. The constant chop, the consistent hugging of the 50DMA by the S&P 500, and the inability of volatility to make a move are all non-supportive for any fundamental bearishness. It does not even make sense to try to get “pro-actively” bearish. This is even more true if China’s rate cut succeeds in calming nerves and keeping traders in their stratospheric positions. But given the convergence and confluence of events, which now includes what could actually be the end game for Greece, I am officially on alert. Interested readers should check out my study from 2011 that demonstrated that trading in the summer can lead to gains for bulls, but when things go bad, they get VERY bad: “Summer’s Positive Gains Can Come With High Risks.” In other words, it PAYS to pay attention over the summer. Don’t sleep…
Daily T2108 vs the S&P 500
")
Black line: T2108 (measured on the right); Green line: S&P 500 (for comparative purposes)
Red line: T2108 Overbought (70%); Blue line: T2108 Oversold (20%)
Weekly T2108

*All charts created using freestockcharts.com unless otherwise stated
The T2108 Resource Page
Expanded daily chart of T2108 versus the S&P 500
Expanded weekly chart of T2108
Be careful out there!
Full disclosure: short CSIQ shares, long CSIQ calls, long EEM calls,