
(T2108 measures the percentage of stocks trading above their respective 40-day moving averages [DMAs]. It helps to identify extremes in market sentiment that are likely to reverse. To learn more about it, see my T2108 Resource Page. You can follow real-time T2108 commentary on twitter using the #T2108 hashtag. T2108-related trades and other trades are sometimes posted on twitter using the #120trade hashtag. T2107 measures the percentage of stocks trading above their respective 200DMAs)
T2108 Status: 42.5%
T2107 Status: 45.5%
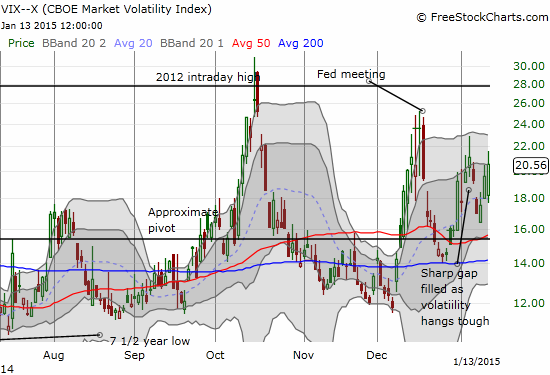
VIX Status: 20.6 (up 4.9%)
General (Short-term) Trading Call: Bearish
Active T2108 periods: Day #59 over 20%, Day #18 above 30%, Day #5 above 40% (overperiod), Day #9 under 50%, Day #27 under 60%, Day #129 under 70%
Reference Charts (click for view of last 6 months from Stockcharts.com):
S&P 500 or SPY
SDS (ProShares UltraShort S&P500)
U.S. Dollar Index (volatility index)
EEM (iShares MSCI Emerging Markets)
VIX (volatility index)
VXX (iPath S&P 500 VIX Short-Term Futures ETN)
EWG (iShares MSCI Germany Index Fund)
CAT (Caterpillar).
Commentary
Friday’s perfect pause for the S&P 500 (SPY) has definitively given way to another breakdown of the 50-day moving average.
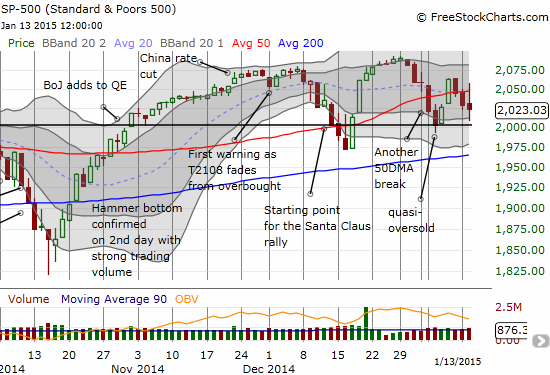
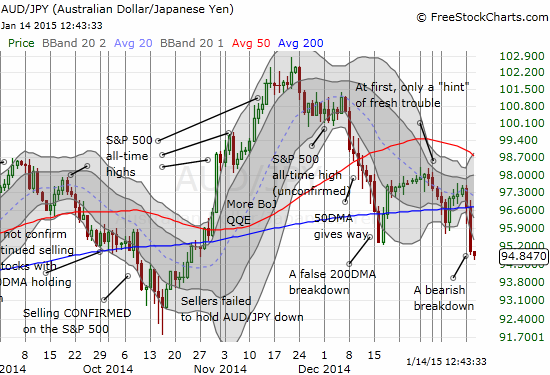
With T2108 closing essentially flat in a perfect stalemate on the day, I would have concluded nothing of concern from the S&P 500’s latest failure to hold 50DMA support. The day even featured a positive sign with the index breaking ABOVE its 50DMA at one time. However, the Australian dollar (FXA) versus the Japanese yen (FXY) (AUD/JPY) delivered a fresh warning with a 200DMA breakdown during the trading day.
$AUDJPY ringing alarm bells for market as it drops below its 200DMA amid continued strength in the yen. $SPY
— Dr. Duru (@DrDuru) January 13, 2015
That warning is ringing all the louder at the time of typing as AUD/JPY continues to sink quick, fast, and in a hurry. The tell-tale currency pair has now broken below December’s low and seems like a lock to retest October’s low. I cannot imagine this retest happening without dragging the S&P 500 down as well. Thus, I have definitively changed my trading call to bearish for the first time in a long time.
The palpable cause for concern is a sudden plunge in copper prices in the early hours of Asian trading. This chart was posted on stocktwits just as I was trying to find out the catalyst for a sudden plunge in the Australian dollar across all major currencies.

Source: StockTwits post
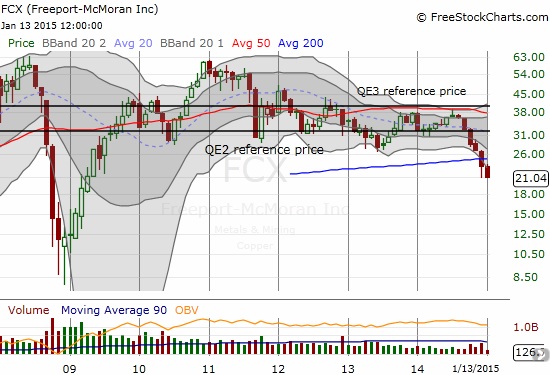
This augurs very poorly for trading as so many assume that so goes copper, so goes the global economy. With the on-going collapse in commodities, this fresh plunge in copper is like the next shoe to drop. Indeed, during U.S. trading Freeport-McMoRan Inc. (FCX) crumbled 7.6%. At first blush, I somehow thought going ex-dividend had something to do with the drop. In retropsect, the plunge had to be more than a dividend payout. FCX is now back to December’s low.
I think this is enough said for the prospects of trading on Wednesday, January 14th. The only caveat I can muster is that AUD/JPY has already extended well below its lower-Bollinger Band (BB) so some kind of snapback should be expected. But all things considered, I have to assume such a bounce will be as temporary as the last one.
Volatility is also hanging tough. I am now on alert for a major run-up and spike higher. I will be waiting for T2108 to drop at least below 30% before I consider adding to my volatility fade. I will sell my small position in ProShares Short VIX Short-Term Futures (SVXY) if I get another shot at a small profit before this presumed run-up.
I think the odds of T2108 trading down to oversold conditions before the end of this month just shot up considerably. As usual, I will look to buy on such a turn of events. Given my assumption of on-going chop in the market, I am still avoiding over-reacting to any one day’s movement. Instead, my bearish bias just green lights fading rallies and playing follow-through from breakdowns.
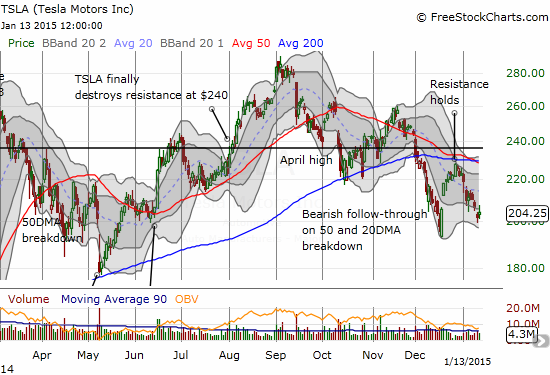
I end with a chart on Tesla Motors (TSLA). I last pointed out TSLA a month ago when it generated a bearish follow-through to a 50/200DMA breakdown. The Santa Claus rally helped it to recover only to hit and fail at resistance that has also led to more bearish follow-through. I mention this because TSLA plunged below its December low in after-hours trading after Elon Musk mentioned disappointing sales in China. He later tried to clarify the situation as temporary and based on misperceptions about Tesla’s charging capabilities. The market may not have anticipated such a hiccup but this was certainly a bad time to make such statements with the stock setup like a classic short. And now general market weakness will work further against a rapid recovery from the latest swoosh lower.
Daily T2108 vs the S&P 500
")
Black line: T2108 (measured on the right); Green line: S&P 500 (for comparative purposes)
Red line: T2108 Overbought (70%); Blue line: T2108 Oversold (20%)
Weekly T2108

*All charts created using freestockcharts.com unless otherwise stated
The T2108 Resource Page
Expanded daily chart of T2108 versus the S&P 500
Expanded weekly chart of T2108
Be careful out there!
Full disclosure: net short Australian dollar, long SVXY, long FCX, short TSLA, long TSLA call spread (essentially zero now!)