
(T2108 measures the percentage of stocks trading above their respective 40-day moving averages [DMAs]. It helps to identify extremes in market sentiment that are likely to reverse. To learn more about it, see my T2108 Resource Page. You can follow real-time T2108 commentary on twitter using the #T2108 hashtag. T2108-related trades and other trades are sometimes posted on twitter using the #120trade hashtag. T2107 measures the percentage of stocks trading above their respective 200DMAs)
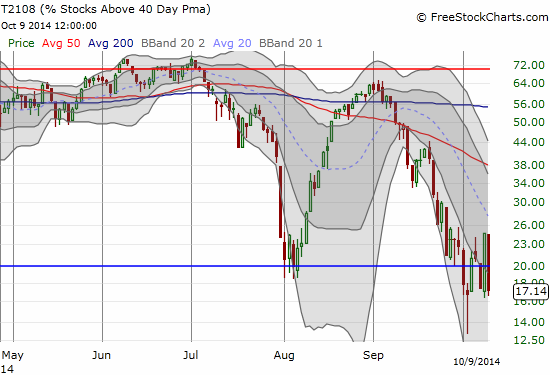
T2108 Status: 17.1% (1st day of 3rd oversold period in last 7 trading days)
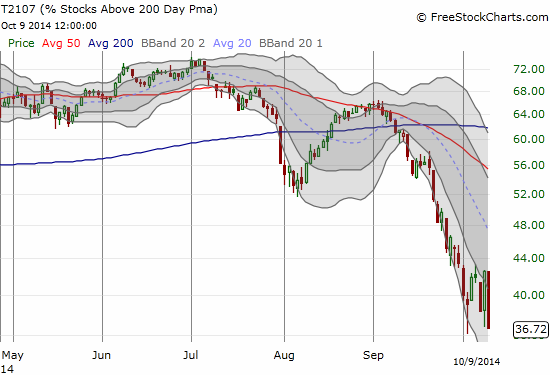
T2107 Status: 36.7% (near 3-year low!)
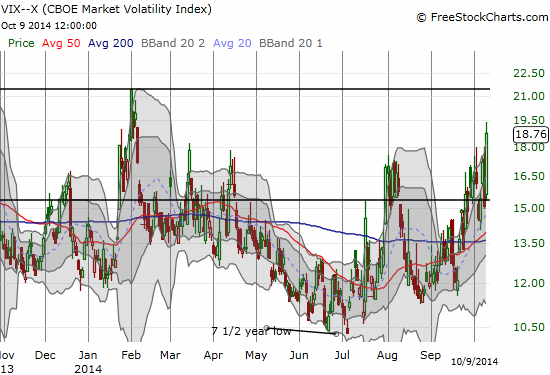
VIX Status: 18.8
General (Short-term) Trading Call: Here we go again! Reduce shorts, aggressive traders add/start longs and accumulate more if/when VIX breaks a previous high, conservative traders wait to see what happens after the oversold period ends. See below for more details and explanations.
Active T2108 periods: Day #1 under 20% (1st day of oversold period), Day #13 under 30%, Day #19 under 40%, Day #21 under 50%, Day #23 under 60%, Day #65 under 70%
Reference Charts (click for view of last 6 months from Stockcharts.com):
S&P 500 or SPY
SDS (ProShares UltraShort S&P500)
U.S. Dollar Index (volatility index)
EEM (iShares MSCI Emerging Markets)
VIX (volatility index)
VXX (iPath S&P 500 VIX Short-Term Futures ETN)
EWG (iShares MSCI Germany Index Fund)
CAT (Caterpillar).
Commentary
Here we go again. Except THIS oversold period looks ominously different.
T2108 plunged a nasty 30% to 17.4% to return its entire gain from yesterday (October 8th). T2107, the percentage of stocks trading above their 200DMAs, is nearing a 3-year closing low.
The big change occurred in the currency market. My favorite bear/bull confirmation took a very bearish tumble today. The Australian dollar versus the Japanese yen (AUD/JPY) finally broke through 200DMA support and confirmed today’s steep drop in the S&P 500 (SPY) with an exclamation point.
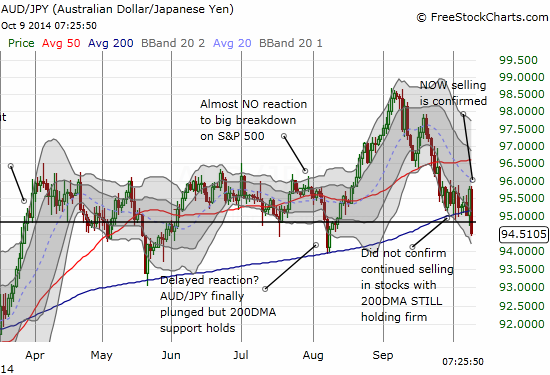
I took this snapshot shortly after the market close. At the time of typing, AUD/JPY continues is mounting a very small comeback. I will be following its direction and momentum closely going into the U.S. open.
I anticipated the potential quick return to oversold conditions last time based on overhead resistance at the 50DMA. I thought the second bounce from oversold would give the 50DMA resistance more of a challenge. Instead, it seems the market is now primed for a more extended stay in oversold territory.
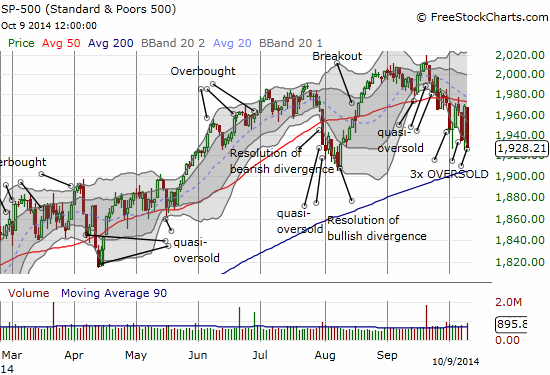
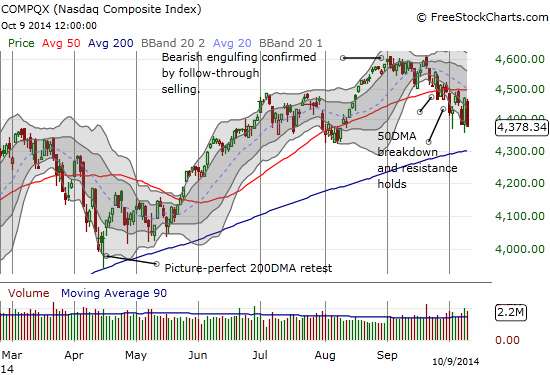
This constant bouncing up and down is going to exhaust one, or even both, sides of the market. Either the market is shaking out buyers or shaking out sellers. In each case, traders who have chased the momentum of the day have found themselves clobbered the next day. Those who have patiently waited at resistance or, like me, patiently waited for entries ahead of an oversold bounce, have received the pay-offs. This kind of churn cannot continue because at some point traders start to anticipate and that anticipation forces new patterns to emerge.
I was following the action as best I could (I did not have stock price alerts handy). When I noticed the VIX creeping upward, I got ready. THIS time, there was no magical end to the surge at the previous high. Once the VIX broke higher, I bought a new tranche of SSO call options. I did not get aggressive because the new bar to hit is a high higher than the last: 21.4 on February 3rd. I bought the small amount “just in case” sellers and fear fail to push the VIX to or past the next point of aggressive oversold trading. I also bought a small amount of SSO shares as I am getting a stronger feeling that getting through this oversold period may require a good helping of patience.
I would have added to my position of ProShares Ultra VIX Short-Term Futures (UVXY), but I did not get the discount I was looking for despite the 17% gain. The upshot is that my existing puts on UVXY “only” lost all their profit and are price where I bought them. (It was still HARD to watch all that green evaporate as I stuck to my position!).
In addition to welcoming shares and a fresh crop of SSO call options to the family, I released one more short position back into the stock jungle: First Solar (FSLR). FSLR looks like it has made a classic topping pattern with two rounded tops that both failed to take out the highs set by a climactic style of buying after this year’s analyst day in April. The breakdown below the 200DMA, a fresh low, and a complete reversal of the analyst day surge all confirm weakness. FSLR is one that can likely be faded on strength. The on-going collapse in energy prices and commodities will likely dampen sentiment further. Like steel stocks, I need to get back to the soapbox analyzing solar stocks!
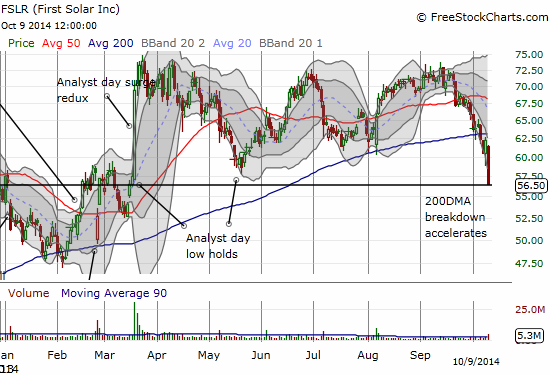
I considered FSLR a good short to close out during the oversold period because the selling extended so far below the lower-Bollinger Band. It does not have to bounce sharply from here, but it is very likely to do so soon…especially once the general stock market makes a move out of oversold conditions (trust me, it WILL at some point!).
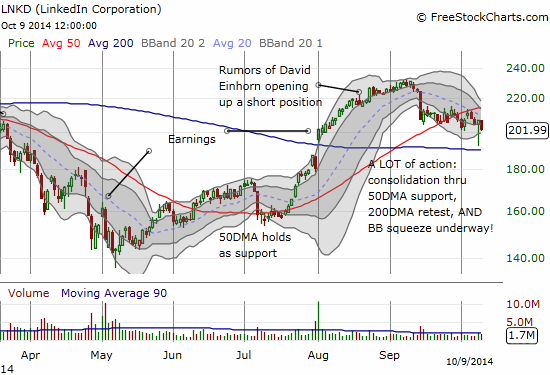
Another stock of interest is LinkedIn (LNKD). I have wrestled with this stock for much of the year. I took advantage of the pre-earnings run-up to close out my last position at a profit. So, it has been VERY tempting to get back in on the current dip, but the technicals are so mixed here. I like the consolidation but hate the break below the 50DMA. I like the retest of the 200DMA but hate the long 1-day trip to do it. I LOVE the Bollinger Band squeeze building, but I cannot develop an opinion on a breakout or a breakdown. So, it seems like a perfect options straddle or strangle candidate.
So, how low can T2108 go before the S&P 500 bounces again? That is anyone’s guess. T2108 went as low as 1.25% (yikes!!!) in 2008 in an awesome display of cataclysmic fear. T2108 went as low as 6.5% during the last big sell-off in 2011. These experiences have taught me to combine the VIX with the timing of entries for oversold trading. They have also taught me to buy shares instead of options when the going seems particularly rough (like now).
You may also ask why not focus on fading strength given the apparent stiff resistance at the 50DMA. I think that is a comfortable move for anyone who expects a much deeper sell-off. I am not there yet. Plus, a fresh bounce from oversold conditions is a poor risk/reward play even though it looks like pure genius right now. Of course I apply a huge exception to downside hedges like Caterpillar (CAT). I sold the latest round of puts right away today…and apparently a bit too early!
Daily T2108 vs the S&P 500
")
Black line: T2108 (measured on the right); Green line: S&P 500 (for comparative purposes)
Red line: T2108 Overbought (70%); Blue line: T2108 Oversold (20%)
Weekly T2108

*All charts created using freestockcharts.com unless otherwise stated
The T2108 Resource Page
Expanded daily chart of T2108 versus the S&P 500
Expanded weekly chart of T2108
Be careful out there!
Full disclosure: long SSO call options and shares, long UVXY puts, net long the Australian dollar