
(T2108 measures the percentage of stocks trading above their respective 40-day moving averages [DMAs]. It helps to identify extremes in market sentiment that are likely to reverse. To learn more about it, see my T2108 Resource Page. You can follow real-time T2108 commentary on twitter using the #T2108 hashtag. T2108-related trades and other trades are sometimes posted on twitter using the #120trade hashtag. T2107 measures the percentage of stocks trading above their respective 200DMAs)
T2108 Status: 21.1% (unchanged)
T2107 Status: 41.9% (essentially unchanged)
VIX Status: 15.5 (drop of 10% below 15.35 pivot)
General (Short-term) Trading Call: Hold longs, remaining shorts should be closed if/once S&P 500 and/or the NASDAQ close above 50DMA. More details in the last T2108 Update
Active T2108 periods: Day #2 over 20% (oversold period), Day #10 under 30% (undersold period), Day #16 under 40%, Day #18 under 50%, Day #20 under 60%, Day #62 under 70%
Reference Charts (click for view of last 6 months from Stockcharts.com):
S&P 500 or SPY
SDS (ProShares UltraShort S&P500)
U.S. Dollar Index (volatility index)
EEM (iShares MSCI Emerging Markets)
VIX (volatility index)
VXX (iPath S&P 500 VIX Short-Term Futures ETN)
EWG (iShares MSCI Germany Index Fund)
CAT (Caterpillar).
Commentary
Somehow, Caterpillar (CAT) managed to trade up on the day while the S&P 500 (SPY) and the NASDAQ (QQQ) ran into buzzsaws at 50-day moving average (DMA) resistance. Perhaps it was the sharp reversal in the U.S. dollar that boosted commodities (temporarily) and thus encouraged some buying in CAT. Whatever the reason, I do NOT consider this a bullish divergence.
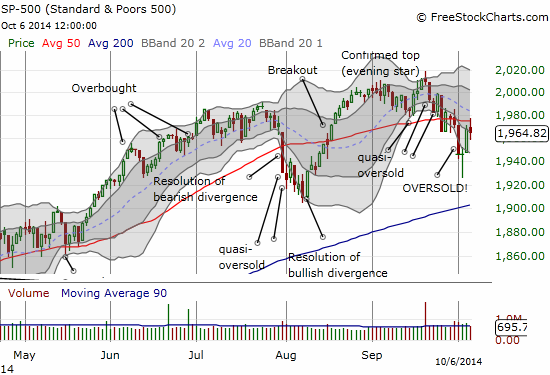
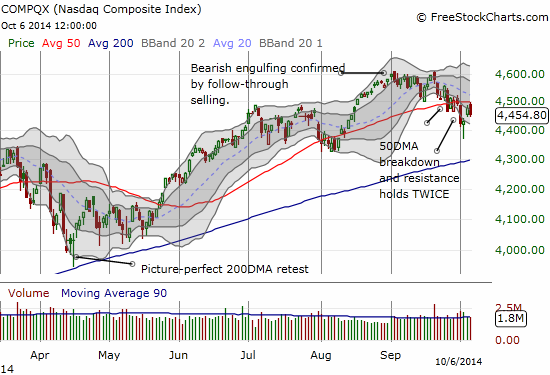
The day started off in an encouraging fashion as the S&P 500 opened lower and then ran up above the 50DMA. I quickly moved to secure some profits in my ProShares Ultra S&P500 (SSO) call options. I started to move in more speculative call options on stocks and ETFs like Google (GOOG) and iShares MSCI Emerging Markets (EEM) as it gapped above its 200DMA mainly thanks to a post-election surge in Brazilian stocks. I stopped as soon as I noticed the upward momentum had stopped. Perhaps I never would have started if I had noticed that the NADSAQ ran smack into a brick wall of resistance at its 50DMA.
So, on balance, the bullish bounce from oversold conditions remains intact, but T2108 could easily slip back into oversold territory from here. If so, I will go right back to the T2108 rules and load up on fresh SSO call options. I will be much more aggressive the second time around as the T2108 30% underperiod is starting to get long in the tooth. Recall that the 30% underperiod has a mean duration of 7 days and a median between 3 and 4. The current 30% underperiod is now 10 days old.
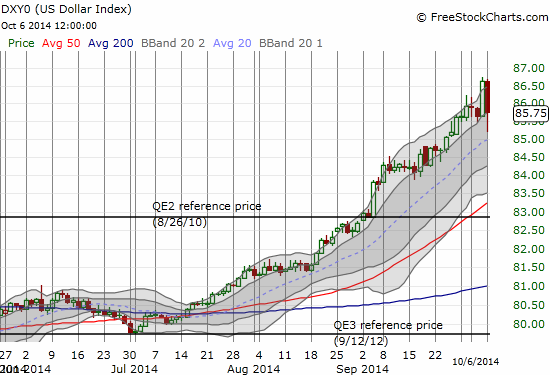
Volatility is alive and strong and I think noticeably higher. The VIX raced back to the 15.35 pivot level and seems ready to put up a fight for the previous highs it gapped away from. The U.S. dollar took a sudden and abrupt dive demonstrating that volatility is definitely coming back in currency markets. It reversed all its gains and then some from Friday’s jobs report and just managed to close back on trend.
Speaking of abrupt reversals, I conclude with a nasty chart of GT Advanced Technologies (GTAT). It is one for the ages as I cannot remember a single time a company has declared bankruptcy so suddenly and abruptly. It is a stark reminder to us all how just about anything is possible in the stock market. I will not call this a Black Swan event, but I will call it a potential indicator of sustained increase in baseline volatility in the stock market.
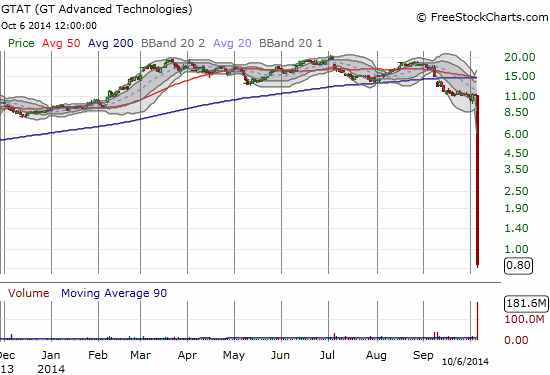
As a friend pointed out to me, GTAT’s 183,290,799 shares traded on the day (not sure why Yahoo! Finance’s number is higher than FreeStockChart.com’s) is over three times the number of shares short as of September 15, 2014. This SHOULD mean shorts have pretty much covered – all that is left is the hope that somehow GTAT will somehow maintain its equity in the Chapter 11 filing (not likely it seems). (And if you are STILL short GTAT, you are truly defining the epitome of greed!)
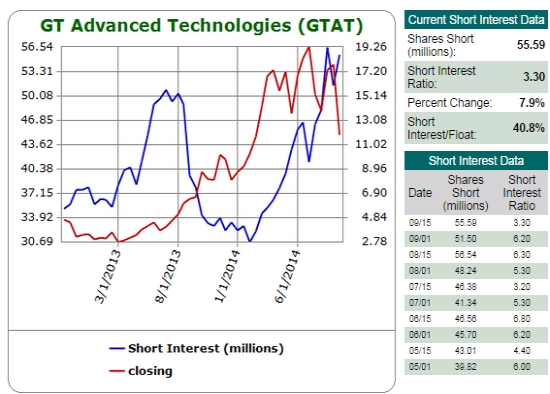
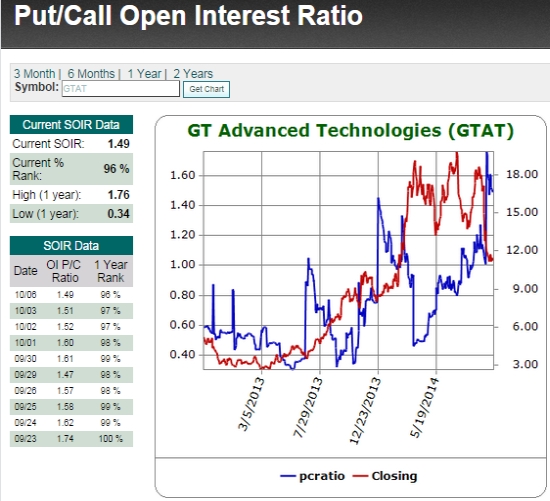
Source: Schaeffer’s Investment Research
- “It seems abundantly clear that there was a fundamental, severe breakdown in the relationship between Apple (NASDAQ:AAPL) and GT,” says Raymond James’ Pavel Molchanov, taking stock of GT Advanced’s (NASDAQ:GTAT) bombshellChap. 11 announcement.
- Molchanov, who downgraded GT to Underperform on Aug. 28, speculates Apple may have “unilaterally opted for a different sapphire supplier for purely business reasons,” or that GT’s Mesa, AZ plant may have “suffered serious technical defects and was unable to meet the agreed-upon obligations with Apple.” He expects GT’s equity will most likely prove worthless.
- Gilford Securities Nimal Vallipuram thinks Apple may have requested “prepayment of some loans due to GTAT not meeting performance targets related to sapphire manufacturing.” Nonetheless, he doesn’t get why “the two companies did not restructure the agreement to buy some time for GTAT.”
- Matt Margolis: “It is evident now that GTAT did not meet the required metrics to receive the final prepayment from Apple. In addition, GTAT burned through $248m of cash during the past two months.” Back in August, GT said it expected a final $139M prepayment from Apple by the end of October.
Daily T2108 vs the S&P 500
")
Black line: T2108 (measured on the right); Green line: S&P 500 (for comparative purposes)
Red line: T2108 Overbought (70%); Blue line: T2108 Oversold (20%)
Weekly T2108

*All charts created using freestockcharts.com unless otherwise stated
The T2108 Resource Page
Expanded daily chart of T2108 versus the S&P 500
Expanded weekly chart of T2108
Be careful out there!
Full disclosure: long SSO call options, long UVXY put options, long GOOG call options, long EEM call options