
(T2108 measures the percentage of stocks trading above their respective 40-day moving averages [DMAs]. It helps to identify extremes in market sentiment that are likely to reverse. To learn more about it, see my T2108 Resource Page. You can follow real-time T2108 commentary on twitter using the #T2108 hashtag. T2108-related trades and other trades are sometimes posted on twitter using the #120trade hashtag. T2107 measures the percentage of stocks trading above their respective 200DMAs)
T2108 Status: 17.4% (1st day of oversold period)
T2107 Status: 38.4% (fresh 2-year closing low!)
VIX Status: 17.2 (fresh 7-month closing high)
General (Short-term) Trading Call: Start closing shorts; aggressive traders start buying, maximized on next VIX “spike”
Active T2108 periods: Day #1 under 20% (undersold period), Day #11 under 30%, Day #17 under 40%, Day #19 under 50%, Day #21 under 60%, Day #63 under 70%
Reference Charts (click for view of last 6 months from Stockcharts.com):
S&P 500 or SPY
SDS (ProShares UltraShort S&P500)
U.S. Dollar Index (volatility index)
EEM (iShares MSCI Emerging Markets)
VIX (volatility index)
VXX (iPath S&P 500 VIX Short-Term Futures ETN)
EWG (iShares MSCI Germany Index Fund)
CAT (Caterpillar).
Commentary
I should have used yesterday’s pop in Caterpillar (CAT) despite market weakness to launch a new fade on the stock.
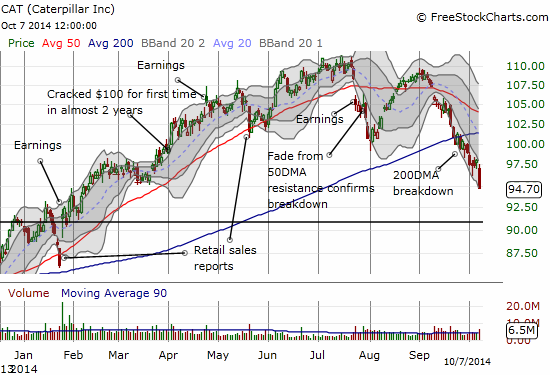
I had been waiting for CAT to bounce and retest 200DMA resistance to rebuild my favorite downside hedge. That moment never came and instead CAT has continued on the slide that I feared was developing soon after CAT broke $100 below its 200DMA. I am still targeting a fill of the January gap up as CAT’s first solid locus of support.
The freefall in CAT is the clearest sign that sellers are starting to take firmer control of the market. However, there is still an oversold condition to cause sellers likely angst.
T2108 closed at 17.4% to begin a second oversold period just 2 days after the last oversold period. For context, recall that oversold period was the first since June, 2013. The chart below is a reminder that the 20% overperiod, the set of trading days where T2108 stays out of oversold conditions, can be quite short.
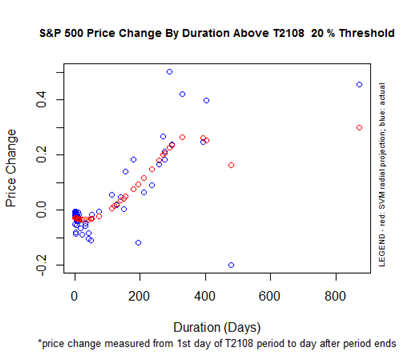
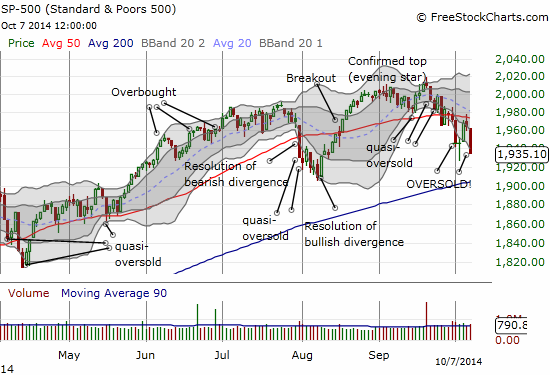
(When I last presented this chart, I neglected to point out that I should have and could have used this to predict the end of the 20% overperiod that began in June, 2013. The projected maximum gain of 27% was tagged almost exactly on September 18, 2014 – the current all-time closing high on the S&P 500. THe next day came the “evening star” – a classic candlestick topping pattern at the end of an uptrend. You just can’t make this stuff up!).
Time is still ticking on the selling pressure if the history of the 30% underperiod is any indication. As a reminder, the 30% underperiod has a mean duration of 7 days and a median between 3 and 4. The current 30% underperiod is now 11 days old.
The chart below suggests that if sellers are able to maintain this pressure for another 5 trading days or so, suddenly the expected performance for the S&P 500 upon exiting this underperiod starts to decline. It first becomes negative around 19 trading days.
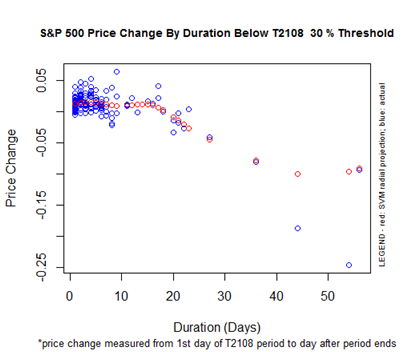
The 30% underperiod began on September 23rd. The S&P 500 (SPY) is down 2.4% since then, well below projected levels for the end of this period. Since this period WILL end (trust me), aggressive traders can start buys here in anticipation of the next oversold bounce. And that is exactly what I did today. I started a fresh round of call options on ProShares Ultra S&P500 (SSO) expiring this Friday (very cheap but very risky) and next Friday (a lot less risky). I will not add to the position (or start a new one as the case may be) until/if the VIX spikes above the last high. That trigger worked well in the last short oversold period.
The volatility index, the VIX, spiked 11.3%. It fell short of the August 1st high but still hit a 7-month closing high.
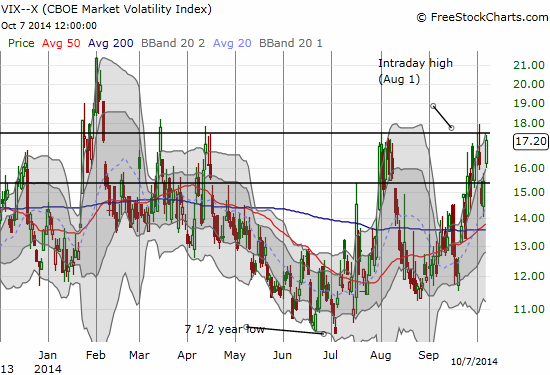
Supporting this spike in the VIX was the surge in selling on the S&P 500 and the NASDAQ (QQQ).
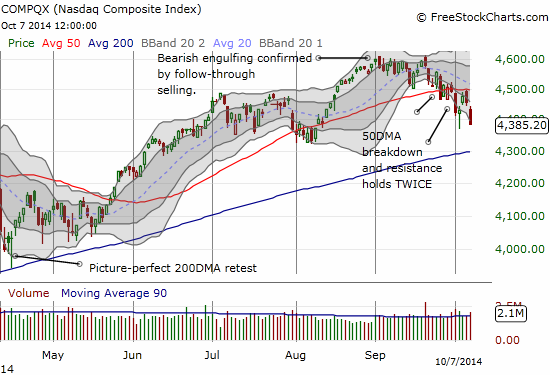
Both major indices are moving in nearly identical technical patterns now. At the current intensity of selling, a rendezvous with the 200DMA at some point seems very likely for both indices, intervening oversold bounces notwithstanding. An ideal retest would involve a a gap down or large swoosh that sends the VIX skyward.
So why not just follow the short-term downtrend and press short positions? My explanation is simple: oversold trading conditions are an extreme, and the market does not like sitting still in extremes – especially selling extremes. The risk/reward for NEW short positions is much better on rallies. I am guessing plenty of bears took that risk as the S&P 500 ran into its 50DMA resistance. Ultimately, the biggest reason for not going overboard with shorts is that this is still a bull market, and there is still a very strong uptrend in place. I think charts are handy, visual reminders. I use SPY (weekly) here because my S&P 500 chart is full of notes.
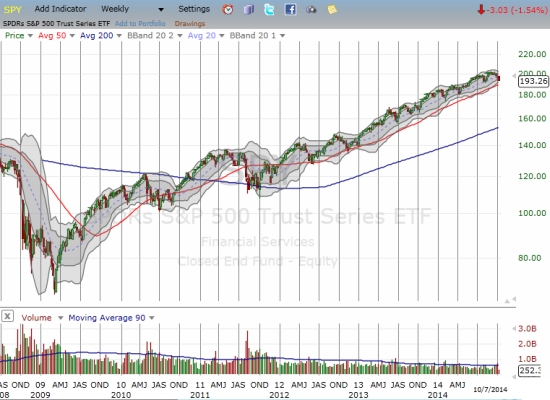
This chart is what has helped make oversold periods such successful trades and overbought ones so tough to deal with! It is quite remarkable how few times since the historic lows in 2009 that the S&P 500 has actually printed a lower low on this uptrend. The most significant lower low was in the summer of 2011 when the U.S. government seemed intent on sending the U.S. back into a recession. That period produced an extremely sharp and notable sell-off. The last lower low was part of the January/February sell-off and that only lasted a few days before the S&P 500 shot higher. In other words, the perma-bears and sellers have yet to prove they can do serious damage to this market.
I contend that when this bullish uptrend hits its next true speed bump, we will know from a lower low: a break below the August low of 1899. Such a break will happen to coincide with a 200DMA breakdown – notable in of itself, given the LAST break of this powerful uptrend was in November, 2012! This also means that the Black Friday trade is reaching a historic two years without going negative.
Here is a very relevant video from CNBC featuring an anchor and some pundits trying to take to task my favorite permabear Bill Fleckenstein. Of all the bears I follow, I respect Fleck the most, but both sides of this lively argument missed key points. Bulls need to appreciate that this super-rally can easily drive us all to become very complacent. Bears need to admit that trying to call tops year-after-year has simply helped absolutely no one. To Fleck’s credit, he is sooooo non-committal on when to start shorting this market that he has been able to avoid the many wrong calls so many perma-bears keep making. But he has also not participated in the upside these many years…and as you will see from the video, he really doesn’t care! I can only assume he remains confident he will make it all up in a hurry once he finally decides to go short again.
But let’s not get too ahead of the game just yet. What is currently in front of us is a fresh oversold period, featuring intensifying selling pressure. Both the S&P 500 and the NASDAQ printed classic topping patterns last month that are helping to embolden sellers. As I have noted during each oversold period, remember these things always feel painful as they unfold…and they look like “obvious” buying points after they end. So, I stick to the time-test T2108 rules to guide the way.
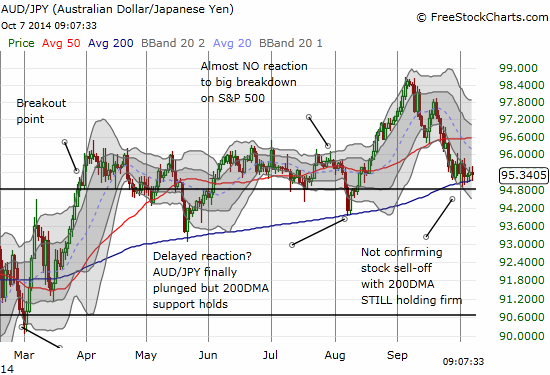
And here is a chart of the Australian dollar versus the Japanese yen (AUD/JPY). It is STILL holding firm at 200DMA support and failing to confirm this sell-off.
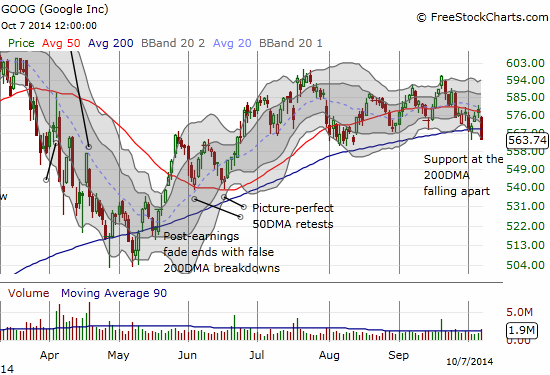
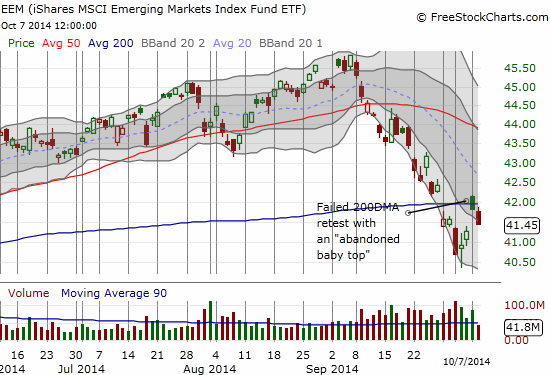
Finally, here are charts to highlight the two mistakes I made on Monday, October 6th when I failed to monitor how BOTH major indices were faring at their 50DMAs. Google (GOOG) is now breaking down below BOTH its 50 and 200DMAs and looks like a short, especially if it cracks the August low around $560. iShares MSCI Emerging Markets (EEM) closed BELOW the 200DMA after gapping up and trading above that important line of resistance. Today, Tuesday, the follow-through selling has printed an ominous “abandoned baby top” which essentially trapped buyers like myself. I definitely prefer to be short EEM here regardless of T2108 conditions. The T2108 rules are only for the S&P 500 anyway. Like CAT, I consider EEM to be a great downside hedge at this juncture especially with the U.S. dollar soaring and commodity prices continuing to collapse.
Daily T2108 vs the S&P 500
")
Black line: T2108 (measured on the right); Green line: S&P 500 (for comparative purposes)
Red line: T2108 Overbought (70%); Blue line: T2108 Oversold (20%)
Weekly T2108

*All charts created using freestockcharts.com unless otherwise stated
The T2108 Resource Page
Expanded daily chart of T2108 versus the S&P 500
Expanded weekly chart of T2108
Be careful out there!
Full disclosure: long SSO call options, long UVXY put options, long GOOG call options, long EEM call options
Great clip. Fleck defends his position with respectable intensity, but he could have done so more simply: “You guys concentrate on making money on the long side. I concentrate on the short side. You get out when you see a top. That’s when I get in. We take turns making money.”
That’s a GREAT way to put it. And of course few people have the patience of someone like Fleck to make a living on surgically timed short-selling.