
(T2108 measures the percentage of stocks trading above their respective 40-day moving averages [DMAs]. It helps to identify extremes in market sentiment that are likely to reverse. To learn more about it, see my T2108 Resource Page. You can follow real-time T2108 commentary on twitter using the #T2108 hashtag. T2108-related trades and other trades are sometimes posted on twitter using the #120trade hashtag. T2107 measures the percentage of stocks trading above their respective 200DMAs)
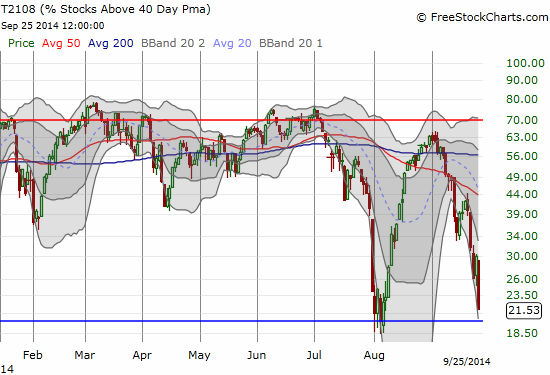
T2108 Status: 21.5%
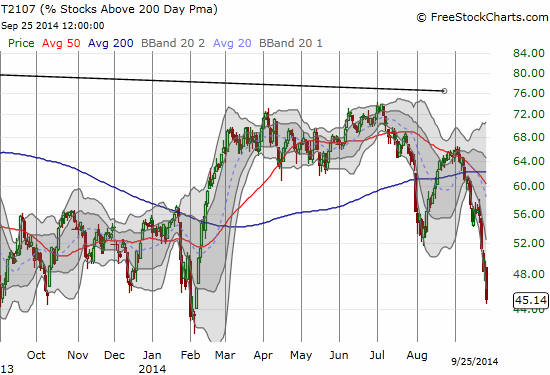
T2107 Status: 45.1% (7 1/2 month low)
VIX Status: 15.6 (17.9% increase!)
General (Short-term) Trading Call: Hold (TRADERS REMAIN READY FOR WIDE SWINGS)
Active T2108 periods: Day #316 over 20% (includes day #280 at 20.01%), Day #3 under 30% (underperiod), Day #9 under 40%, Day #11 under 50%, Day #13 under 60%, Day #55 under 70%
Reference Charts (click for view of last 6 months from Stockcharts.com):
S&P 500 or SPY
SDS (ProShares UltraShort S&P500)
U.S. Dollar Index (volatility index)
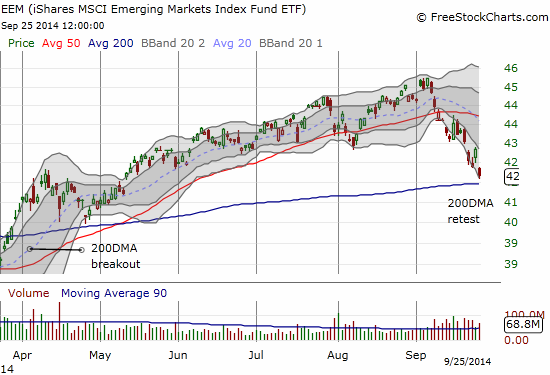
EEM (iShares MSCI Emerging Markets)
VIX (volatility index)
VXX (iPath S&P 500 VIX Short-Term Futures ETN)
EWG (iShares MSCI Germany Index Fund)
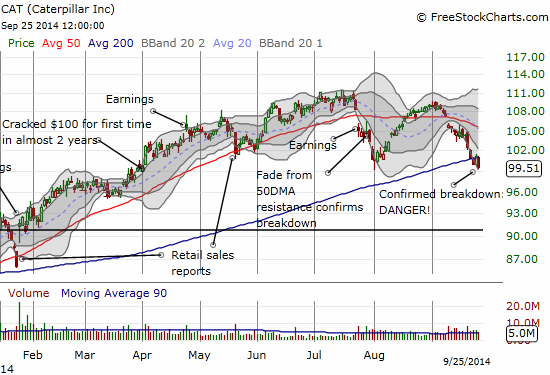
CAT (Caterpillar).
Commentary
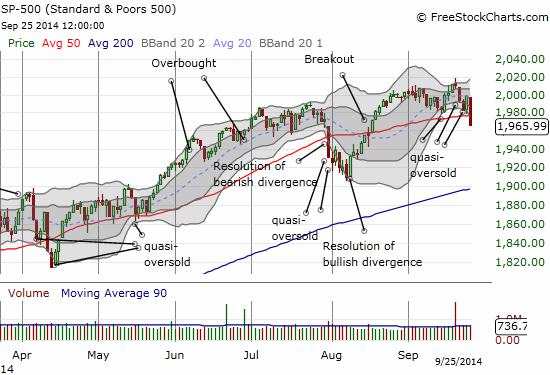
I was looking for today’s trading action on Wednesday when I wrote “A Market Over-stretched and Still Primed to Fall” in Tuesday’s T2108 Update. So give or take a day, the market is now poised perfectly for a (sharp) oversold bounce…or perched precariously on the edge of a major drawdown. It all depends on your perspective.
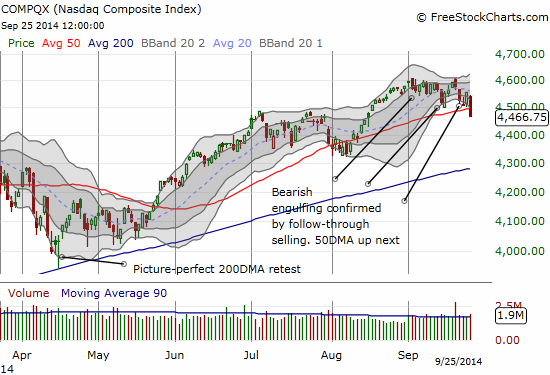
First, the S&P 500 (SPY) and the NASDAQ (QQQ) are perfectly synchronized in the latest breakdown. Both indices sliced right through their respective 50-day moving averages (DMAs). Moreover, they closed well below their lower-Bollinger Bands. By themselves, these closes are in over-stretched positions.
T2108 closed at 21.5%, its third lowest close since last summer.
T2107 is already well into territory that generated conditions for the first big bounce of the year.
You may be asking how could so many stocks trade below these important moving averages and yet the indices trade within spitting distance of major highs? The answer is that the market’s rally has created a lot of uptrends for a lot of stocks. As these moving averages go higher with the trend, the breaks of these averages occur at higher and higher levels on the indices. So now I am in the very uncomfortable position of preparing to buy oversold conditions without a truly major sell-off in the indices to create a necessary flush of selling or negativity. The S&P 500 and the NASDAQ are even comfortably above those August lows that felt so awful at the time (recall how I insisted traders stick with the oversold trade despite the discomfort?).
Fortunately, the volatility index, the VIX, is at least spiking to generate some of the necessary fear. Note that the VIX could easily retest its highs from the August lows.
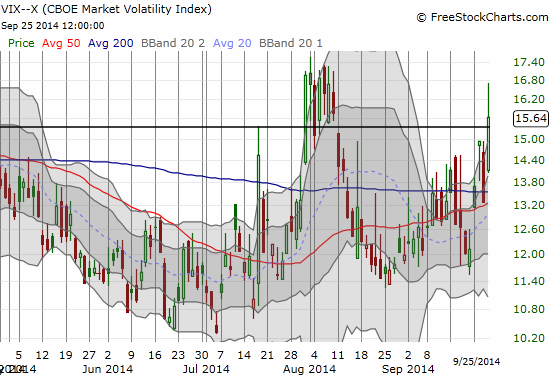
Remember carefully – the overall bias for volatility is now to go higher, so buyers and bulls will not be able to stay comfortable for long on rallies.
The perfect scenario on the heels of all this synchronized sinking would be a large gap down on Friday morning on the indices to stretch even further below the lower-Bollinger Bands, the VIX retesting the August highs, AND T2108 dropping into (and even closing) in oversold territory. I recognize that I rarely get what I ask for on these trades, so I am just going to stay on alert and remain flexible. I am looking for an ideal first entry point for loading up on ProShares Ultra S&P500 (SSO) (call options OR shares) in anticipation of an oversold bounce. As usual, I will also be prepared to trade in multiple tranches. (When/if T2108 closes oversold, I will do a quick refresher on the rules for oversold trading).
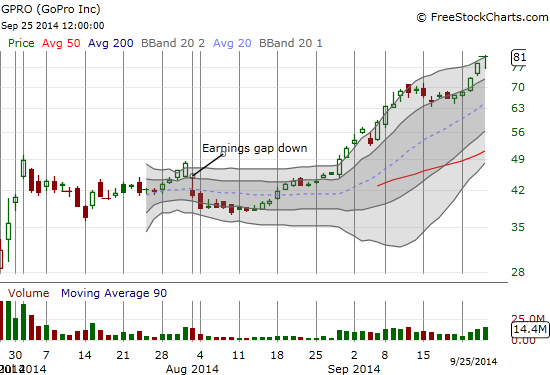
Buyers should beware. The overall technical conditions are once again breaking down on the market. No one can credibly say a big bear market is around the corner, but these conditions DO suggest that you cannot expect trades on the long side to work for long periods of time until the topping signals get broken…unless you are in an invincible and oblivious stock like GoPro, Inc. (GPRO):
In the world outside of GPRO and a few others, synchronized sinking has appeared in other distressing signals of market detereoration. I conclude with just these three:
- Caterpillar (CAT) could not hold 200DMA support
- Emerging markets – represented by iShares MSCI Emerging Markets (EEM) – are facing a critical 200DMA test
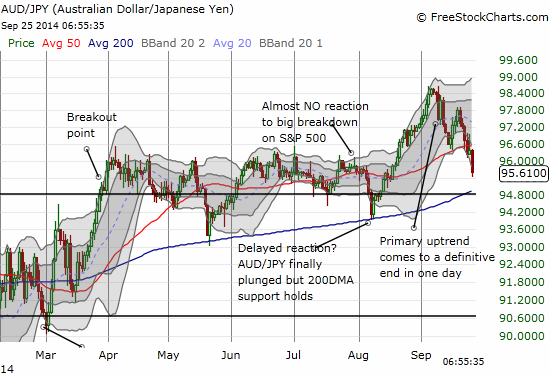
- The Australian dollar continues to sink with the pairing against the Japanese yen continuing to break down…despite what is otherwise general weakness in the Japanese yen as well. A weak Japanese yen is supposed to be good for markets and risk-seeking – it often gets credit for driving the Nikkei higher. I have used AUD/JPY as a more accurate gauge this year.
The trading call remains on hold because I do not want to recommend longs/bulls dump positions just ahead of oversold conditions. I cannot officially tell shorts/bears to take profits and get out the way until T2108 hits oversold. Both camps just better be ready for what promises to be a lot more whipping back and forth…
Daily T2108 vs the S&P 500
")
Black line: T2108 (measured on the right); Green line: S&P 500 (for comparative purposes)
Red line: T2108 Overbought (70%); Blue line: T2108 Oversold (20%)
Weekly T2108

*All charts created using freestockcharts.com unless otherwise stated
The T2108 Resource Page
Expanded daily chart of T2108 versus the S&P 500
Expanded weekly chart of T2108
Be careful out there!
Full disclosure: net short the Australian dollar
Non-large-caps like the MID–X (midcaps), MDY, RUT-X (smallcaps), IWM, IJR, WMCR (microcaps), IWC have already broken their 2014 support trend-lines. We’ll see over the next few days whether this is a false break-down or the real thing.