
(T2108 measures the percentage of stocks trading above their respective 40-day moving averages [DMAs]. It helps to identify extremes in market sentiment that are likely to reverse. To learn more about it, see my T2108 Resource Page. You can follow real-time T2108 commentary on twitter using the #T2108 hashtag. T2108-related trades and other trades are posted on twitter using the #120trade hashtag)
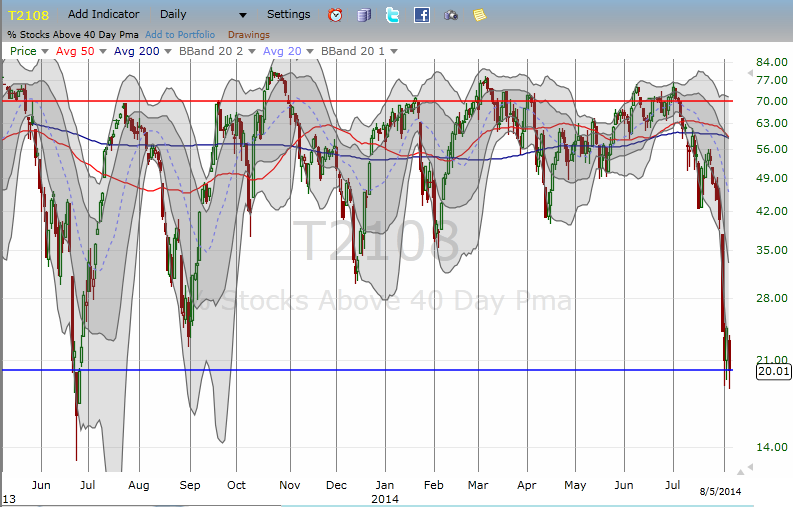
T2108 Status: 20.0% (OVERSOLD for the first time in 271 trading days!)
VIX Status: 16.9
General (Short-term) Trading Call: Selective buying for short-term trades. Fade rallies, preferably at or near resistance. Nuances explained in past three T2108 Updates.
Active T2108 periods: Day #272 over 20% (includes day #271 at 20.0%), Day #3 under 30% and 40% (underperiods), Day #7 under 50%, Day #18 under 60%, Day #21 under 70%
Reference Charts (click for view of last 6 months from Stockcharts.com):
S&P 500 or SPY
SDS (ProShares UltraShort S&P500)
U.S. Dollar Index (volatility index)
EEM (iShares MSCI Emerging Markets)
VIX (volatility index)
VXX (iPath S&P 500 VIX Short-Term Futures ETN)
EWG (iShares MSCI Germany Index Fund)
CAT (Caterpillar).
Commentary
I was ready to call T2108 oversold FINALLY, but a late creep into the close brought T2108 off its lows and right to 20%, the threshold for oversold territory. I consider the market essentially oversold given the two quasi-oversold conditions leading into today (Tuesday, August 5, 2014), but technically it is not.
Click for a larger view…
It is hard to remember the lessons from previous trips to, or close to, oversold, since it has been so long. What sticks in my mind is how awful each episode felt and how much worse I felt if I found myself “under-positioned” once the market suddenly decided to sustain a bounce. This is the context for my eagerness to play this episode relatively aggressively. It also partly explains why I considered Monday’s bounce from quasi-oversold conditions a healthier move than last week’s tepid response. I will wait to a complete review of the trading rules for oversold conditions until T2108 closes officially oversold. If you want a head start, review the materials on the T2108 Resource Page.
Today I did not add to my ProShares Ultra S&P500 (SSO) call options or ProShares Ultra VIX Short-Term Futures (UVXY) put options. I think I have loaded up as much as is warranted under current risk conditions. I will wait until true oversold conditions before reloading on fresh tranches.
I DID sell my latest tranche of UVXY shares into today’s pop. After I did so, I realized it makes more sense to describe my strategy with these shares as an attempt to pay for the SSO call options, not the UVXY puts. Until T2108 drops into true oversold territory, I am much more confident in the eventual fade of UVXY than a strong rally in SSO (in the near-term). Moreover, when I buy the UVXY shares on dips, I can do so with more confidence knowing that I have puts to backstop me in case I get caught buying into the dip that ends the UVXY rally. With this change in accounting, I have about 75% of my SSO calls paid for.
UVXY rallied for an 11% gain as the volatility index, the VIX, jumped across the 15.35 pivot and closed right at the presumed channel.
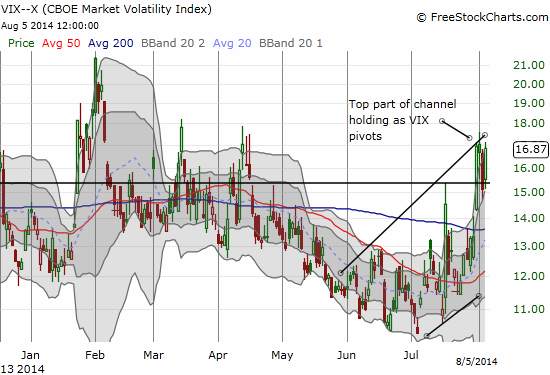
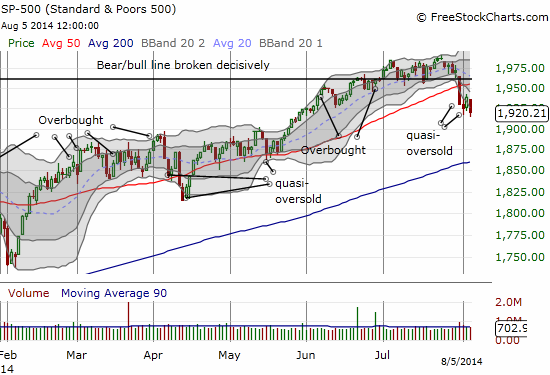
I am a bit surprised the VIX did not close a bit higher given the S&P 500 made a new 2-month low. Sellers are showing off some newly found strength (and courage?) as they were able to punch the index below its lower-Bollinger Band for the third day out of the last four. It has me starting to look downward toward an eventual retest of 200DMA support!
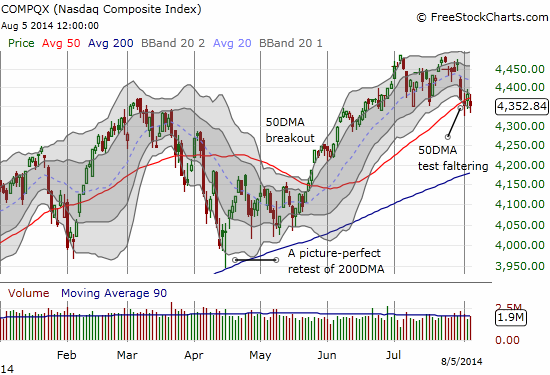
The NASDAQ remains in better techncial shape as it is still clinging to its 50DMA.
What REALLY caught my attention today was the sharp drop in Intel (INTC) for a 3% loss. This move could be just as effective a warning sign for tech as Caterpillar was for the general market. I saw no explanatory news on briefing.com or Yahoo! Finance, so I am left to assume Intel suffered from an old fashioned rush to the exits by sellers assuming the top is in and/or scrambling to lock in impressive profits for the year.
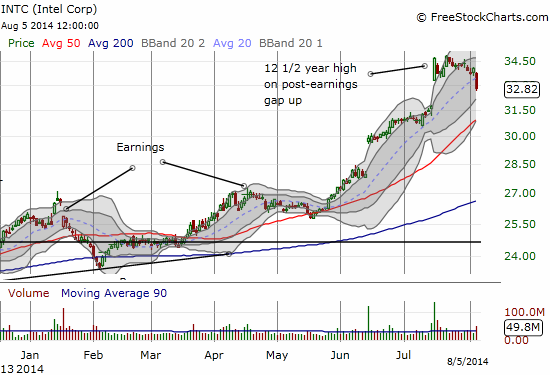
Given the run-up, INTC could become an easy target for shorts betting on a top or a bigger sell-off: INTC is very liquid, there is almost no chance of a squeeze from INTC getting bought out, there is an obvious stop that now looks like an incredible hurdle at 12 1/2 year highs, and the stock has a LOT of downside potential (200DMA retest?) in a major sell-off. So, the more INTC sells off, the more I take that as a signal of the strength of sellers in the market. Interestingly, shorts have been beating a path to the exit on INTC since November, 2013 after a very unsuccessful campaign to fight INTC’s steady rise in 2013. With short interest near 2-year lows I cannot help but wonder whether INTC shorts are about to experience regret again…
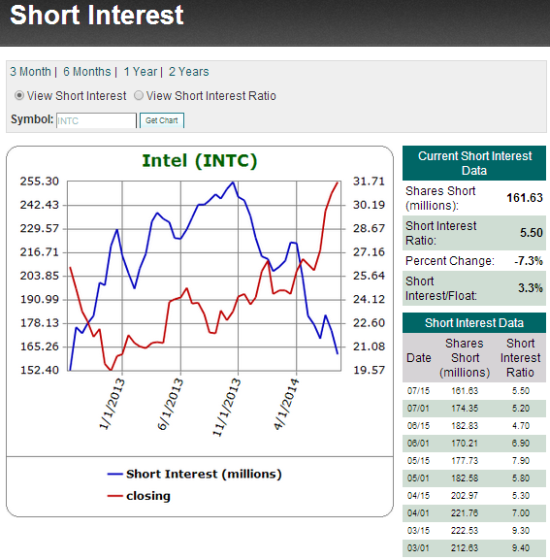
Source: Schaeffer’s Investment Research
Another notable and on-going development is the accelerating exit from Europe-related shares. I pointed out the growing weakness in SPDR EURO STOXX 50 (FEZ) in “Sneaking Out The Euro Amid A Swirl Of Financial Signals.” It was one of those occasions where AFTER writing it, I realized I was not putting enough money where my mouth was. I promptly loaded up on puts on iShares MSCI Germany (EWG) and iShares MSCI Spain Capped (EWP). I locked up profits in EWG last week when T2108 first went quasi-oversold. The selling in EWG has since accelerated. I am still holding the EWP puts as what I thought would be a good contrarian play against the recent out-performance of the European periphery over the core. Today, EWP gapped down below its 200DMA. I figure that is sign enough that much more downside is to come by the time the put options expire in September.
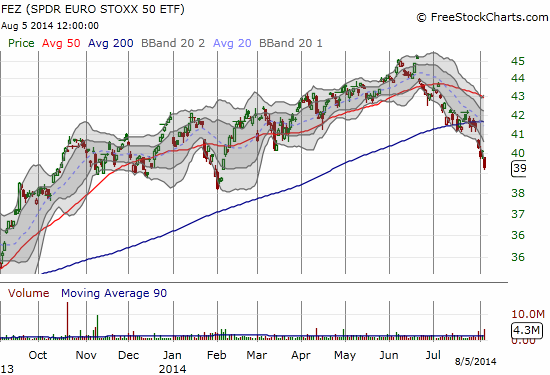
European shares are significantly under-performing U.S. shares. FEZ is now off 11.4% from its 2014 highs. It is also down 5.5% for the year. The euro (FXE) is down 2.7% this year against the U.S. dollar (DXY0).
Daily T2108 vs the S&P 500
")
Black line: T2108 (measured on the right); Green line: S&P 500 (for comparative purposes)
Red line: T2108 Overbought (70%); Blue line: T2108 Oversold (20%)
Weekly T2108

*All charts created using freestockcharts.com unless otherwise stated
Related links:
The T2108 Resource Page
Expanded daily chart of T2108 versus the S&P 500
Expanded weekly chart of T2108
Be careful out there!
Full disclosure: long UVXY puts, long SSO call options, long EWP put options, short the euro