
(T2108 measures the percentage of stocks trading above their respective 40-day moving averages [DMAs]. It helps to identify extremes in market sentiment that are likely to reverse. To learn more about it, see my T2108 Resource Page. You can follow real-time T2108 commentary on twitter using the #T2108 hashtag. T2108-related trades and other trades are posted on twitter using the #120trade hashtag)
T2108 Status: 56.6%
VIX Status: 12.6 (fades hard into the close)
General (Short-term) Trading Call: Hold. Stop for longs on the S&P 500 remains at 1962
Active T2108 periods: Day #254 over 20%, Day #106 over 40%, Day #33 over 60% (overperiod), Day #4 under 70% (underperiod)
Reference Charts (click for view of last 6 months from Stockcharts.com):
S&P 500 or SPY
SDS (ProShares UltraShort S&P500)
U.S. Dollar Index (volatility index)
EEM (iShares MSCI Emerging Markets)
VIX (volatility index)
VXX (iPath S&P 500 VIX Short-Term Futures ETN)
EWG (iShares MSCI Germany Index Fund)
CAT (Caterpillar).
Commentary
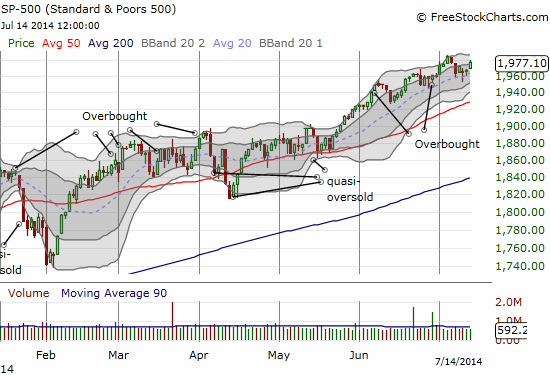
Another shallow pullback, another bout of whiplash for over-eager bears. As I noted last week, despite the seemingly bearish tidings accompanying the tumble from overbought conditions, I was very hesitant to switch the trading call to a bearish one. The 1962 line in the sand I drew for the S&P 500 (SPY) worked out amazingly well. It prevented me from joining the bears in another case of whiplash….like this one.
As I wrote on RealMoneyPro – "Big" has added to his immense Nasdaq short on recent market strength.$QQQ
— Douglas Kass (@DougKass) July 10, 2014
I think this parable of “Big” is a fascinating one to watch. It is a classic attempt to call a top, one of the most difficult market-timing calls to make. I myself have switched to waiting for one of two distinct signals: a breakdown below critical support after falling from overbought conditions; or a major fade on high volume or from critical resistance during overbought conditions. The criteria Big has for going short appears to be that prices are too high and the stock market is over-valued. My guess is that this short was started as a quick-hit play to be closed on the next plunge. After all, Big has not convinced Doug Kass to go any further than a 10% short on QQQ:
Up to 10% net short QQQ weighting now. $QQQ
— Douglas Kass (@DougKass) July 11, 2014
(Note well: I am NOT picking on Kass. I have DEEP respect for him. I think he is one of the better perma-bears to follow because he is not stuck on ideology, doesn’t hate America, and avoids claims of apocalyptic doom, at least when he is not quoting or retweeting the true perma-bears at ZeroHedge. I just happen to disagree with his persistent and constant bearishness on the markets these oh so many months upon months. I cannot even remember when he last had a constructive view on the market.)
Anyway, T2108 surged today as high as 61.8% before falling back to 59.5%. The S&P 500 had a firm uptick that confirmed once again support at the 20DMA uptrend. The index is now poised to make another fresh all-time high. Earnings season is a huge caveat of course, but I find it telling that the pre-earnings jitters have already subsided in this way.
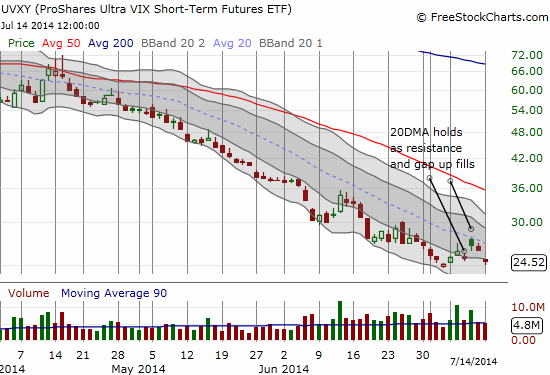
This fresh pop in the S&P 500 returned ProShares Ultra VIX Short-Term Futures (UVXY) to the bottom of last week’s gap up. Puts on UVXY were my preferred way to make a bullish play as I figured volatility was even more likely to sink again than the S&P 500 to pop in the short-term. The trade worked out well as I closed out those puts for a 50% gain.
What I did not realize at the time is that Federal Reserve Chair Janet Yellen is speaking to the U.S. Senate tomorrow (July 15th). Fed events have lately served to dampen volatility (Note well that I need to verify the prevalence with data one of these days; currently I have an informal correlation/relationship from casual observation). Perhaps traders decided to get a jump this time around.
Daily T2108 vs the S&P 500
")
Black line: T2108 (measured on the right); Green line: S&P 500 (for comparative purposes)
Red line: T2108 Overbought (70%); Blue line: T2108 Oversold (20%)
Weekly T2108

*All charts created using freestockcharts.com unless otherwise stated
Related links:
The T2108 Resource Page
Expanded daily chart of T2108 versus the S&P 500
Expanded weekly chart of T2108
Be careful out there!
Full disclosure: no positions