
(T2108 measures the percentage of stocks trading above their respective 40-day moving averages [DMAs]. It helps to identify extremes in market sentiment that are likely to reverse. To learn more about it, see my T2108 Resource Page. You can follow real-time T2108 commentary on twitter using the #T2108 hashtag. T2108-related trades and other trades are posted on twitter using the #120trade hashtag)
T2108 Status: 71.8%
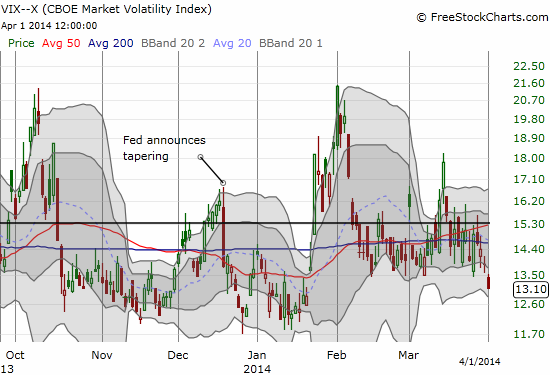
VIX Status: 13.1 (breakdown to 3+ month lows)
General (Short-term) Trading Call: Short (fade rallies)
Active T2108 periods: Day #186 over 20%, Day #35 over 50%, Day #3 over 60%, Day #1 over 70% (overperiod/overbought)
Reference Charts (click for view of last 6 months from Stockcharts.com):
S&P 500 or SPY
SDS (ProShares UltraShort S&P500)
U.S. Dollar Index (volatility index)
EEM (iShares MSCI Emerging Markets)
VIX (volatility index)
VXX (iPath S&P 500 VIX Short-Term Futures ETN)
EWG (iShares MSCI Germany Index Fund)
CAT (Caterpillar).
Commentary
The top in the S&P 500 (SPY) lasted all of two weeks. Now, T2108 has stubbornly hit overbought levels for the fourth time in five weeks and the fifth time in a little over two months.
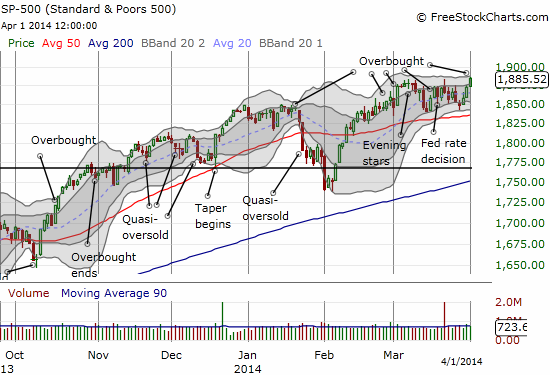
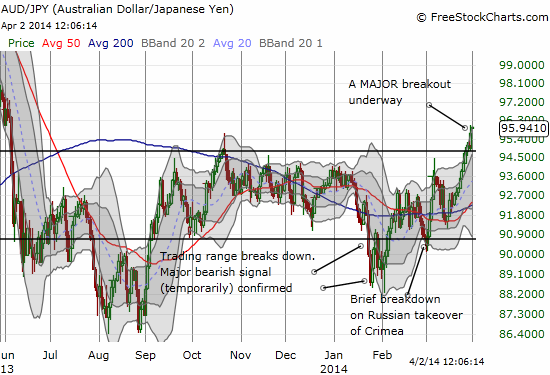
With momentum stocks breaking down this last trading cycle, the overbought conditions looked more bearish than previous overbought cycles. However, as I pointed out earlier, the market never delivered on a rising VIX, and the Australian dollar (FXA) was screaming non-confirmation with its continued rise against the Japanese yen (FXY). Now, the VIX is breaking down and AUD/JPY is breaking out.
So instead of buyer exhaustion leading to a steeper sell-off, it looks like bears and sellers are on the verge of even more exhaustion (if that is possible). A melt-up may be the path of least resistance from here. The market, of course, is not making things THAT easy to decide. I am waiting for more follow-through and confirmation before flipping the trading call from “fade” to buy.
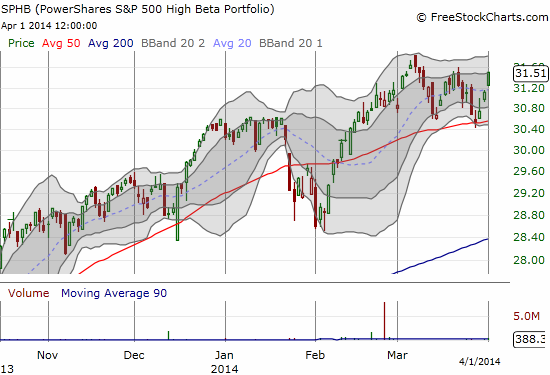
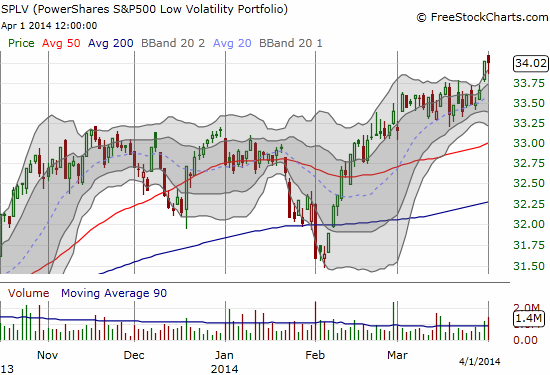
I HAVE switched off the focus of fading just momentum stocks. It so happens that the hints of divergence have appeared between the PowerShares S&P 500 Low Volatility (SPLV) and the PowerShares S&P 500 High Beta (SPHB). SPLV broke out to new all-time highs on Monday (the day before today), but it surprisingly struggled on today’s big moment for the S&P 500 (SPY). Meanwhile, SPHB has recovered its mojo for three straight days now in what looks like a game of catch-up. The interesting dichotomy here is that the breakdown in momentum stocks was supposed to signal a shift in trading strategy for major players (as offered by various pundits from CNBC to Nightly Business Report). Today’s action throws doubt on that assessment.
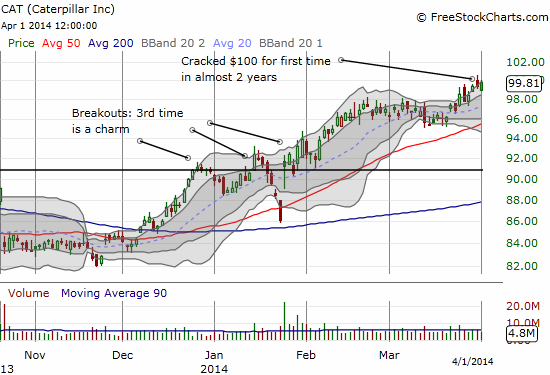
Caterpillar (CAT), often my favorite hedge when going long the market, also gives me pause before churning back to the cheery, bullish case. On Monday, it defied the odds by cracking $100 for the first time in almost 2-years. This is happening shortly after commodities like copper and iron ore plunged and housing stocks all but stalled. The move IS consistent with the surprising strength in emerging market stocks (another non-confirming signal for the bearish case). BUT, CAT could not hold $100 and today managed to gap down a bit before recovering for a small gain. This is not a glaring warning sign yet, just a reason for pause.
I conclude with a quick review of three charts, each representing a different side of the market…
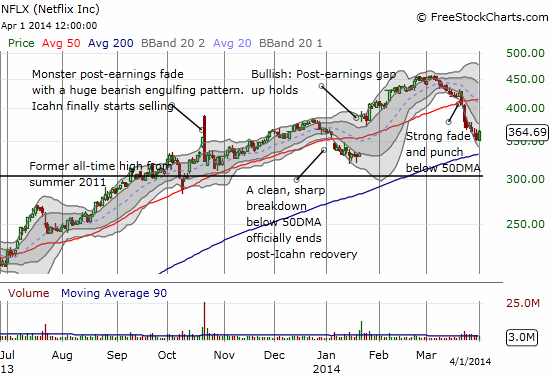
- Netflix (NFLX): my major win from the bearish bias from the last trading cycle. I just wish I played this with outright puts and not a put spread.
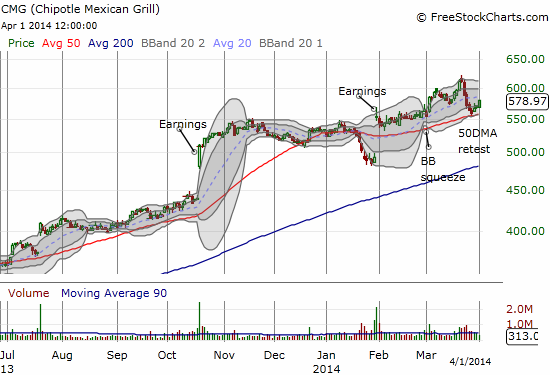
- Chipotle Mexican Grill (CMG): the stock bounced perfectly off its 50-day moving average (DMA). I suspended my bearish bias just enough to allow me to buy. This is also a setup I featured in an earlier post.
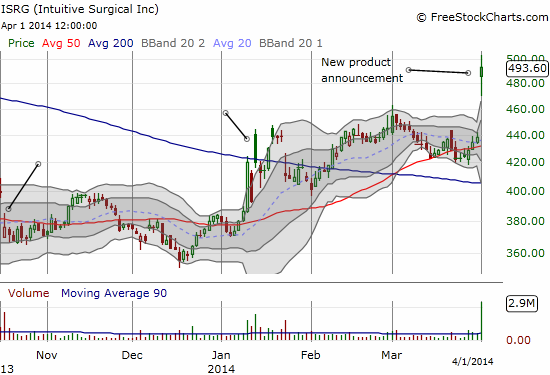
- Intuitive Surgical (ISRG): ISRG announced a new FDA-cleared product, sending the stock hurtling over $500 at one point. While I remain bullish on ISRG (and kicking myself for not staying in position!), I could not resist trying a fade with the stock so far extended past its (upper) Bollinger Band (BB). Sure enough, ISRG eventually faded and I cashed in. My bullishness on ISRG would not allow me to dare thinking of holding such a position longer than I had to. Sure enough, the stock bounced back into the close. Surely, the ability for a former high-flyer like ISRG to remain resilient is a big win for the market (and momentum-playing) bulls.
Daily T2108 vs the S&P 500
")
Black line: T2108 (measured on the right); Green line: S&P 500 (for comparative purposes)
Red line: T2108 Overbought (70%); Blue line: T2108 Oversold (20%)
Weekly T2108

*All charts created using freestockcharts.com unless otherwise stated
Related links:
The T2108 Resource Page
Expanded daily chart of T2108 versus the S&P 500
Expanded weekly chart of T2108
Be careful out there!
Full disclosure: long SSO puts, net short Australian dollar, long EEM puts, long CMG, long CAT shares and put spread,