
(T2108 measures the percentage of stocks trading above their respective 40-day moving averages [DMAs]. It helps to identify extremes in market sentiment that are likely to reverse. To learn more about it, see my T2108 Resource Page. You can follow real-time T2108 commentary on twitter using the #T2108 hashtag. T2108-related trades and other trades are posted on twitter using the #120trade hashtag)
T2108 Status: 57.2%
VIX Status: 14.6
General (Short-term) Trading Call: Short (fade rallies)
Active T2108 periods: Day #183 over 20%, Day #32 over 50% (overperiod), Day #2 under 60% (underperiod), (last overperiod ended at 27 days: 60%), Day #7 under 70% (underperiod)
Reference Charts (click for view of last 6 months from Stockcharts.com):
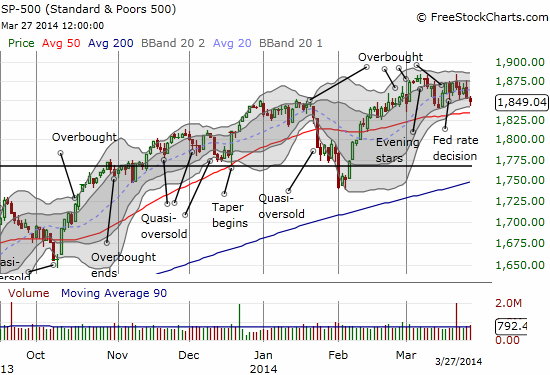
S&P 500 or SPY
SDS (ProShares UltraShort S&P500)
U.S. Dollar Index (volatility index)
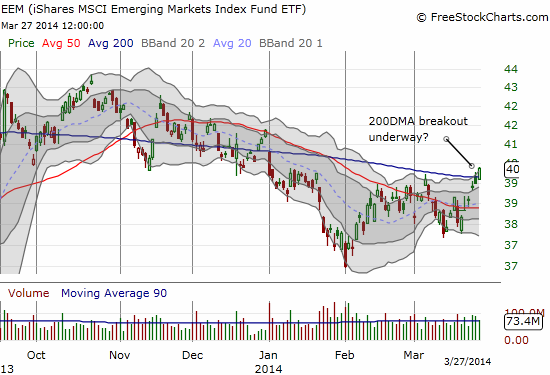
EEM (iShares MSCI Emerging Markets)
VIX (volatility index)
VXX (iPath S&P 500 VIX Short-Term Futures ETN)
EWG (iShares MSCI Germany Index Fund)
CAT (Caterpillar).
Commentary
Since the day momentum died, divergent signals have emerged that are clouding the otherwise bearish signals that have confirmed for me a top in the stock market.
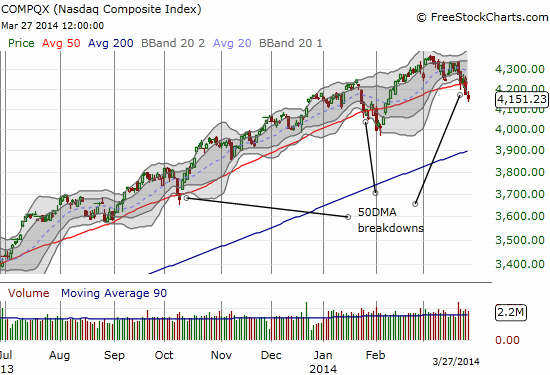
The most interesting divergence crosses the S&P 500 (SPY), the NASDAQ (QQQ), and emerging markets as represented by iShares MSCI Emerging Markets (EEM). The S&P 500 is churning and has not yet broken down from the topping pattern I pointed out almost two weeks ago. The NASDAQ has followed through on the promise of a breakdown, cracking below its 50-day moving average (DMA). When QQQ moved higher on Tuesday, I immediately evoked the trading strategy to fade. I was rewarded later with a crack of the 50DMA upon which I promptly sold my put options to lock in profits. I of course wish I STILL had them! Anyway, strangely enough, EEM has been rallying in parallel; in the exact reverse of the NASDAQ, EEM is breaking out above its 200DMA and looks ready for recovery. See the charts below…
This picture alone is hard to decipher. Let’s mix it up even more.
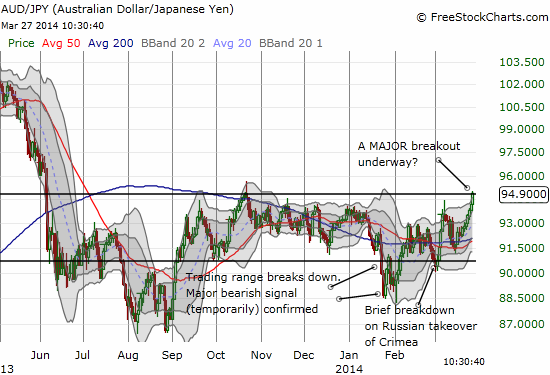
T2108 keep sliding and confirming the growing weakness in (American) stocks. Today (Thursday, March 27, 2014), it closed at 57.2%, a 5-week low, after trading as low as 54.4%. Yet, the volatility index, the VIX, could not keep its head above water. It managed to trade over, you guessed it, the 15.35 pivot for a brief moment before managing to close DOWN for the day. Finally, one of my favorite indicators from the land of currencies is on the edge of a breakout – perfectly timed for EEM’s breakout. The Australian dollar versus the Japanese yen (AUD/JPY) is bursting at the seams. In earlier posts, I have cited such a prospect as a bullish moment.
So what is a technician to do in the face of such a contradiction of signals? First, I am sticking to the fundamental read that a bearish cycle is underway. Second, I am not chasing anything down and choosing to fade rallies. Finally, third, I am looking to individual stocks for hedges with a particular emphasis on stocks that extended well below their lower-Bollinger Bands (BBs).
Here are a bunch of chart reviews to demonstrate the opportunities for swing trades and the extent to which buyers are bailing on momentum. I start with some bullish hints and setups as a reminder of the complexity of the current trading environment.
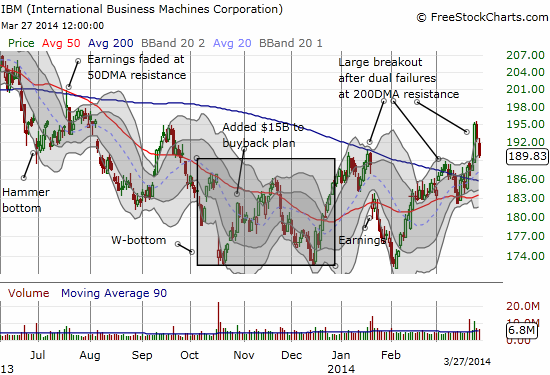
When I made the case for going bullish on International Business Machines (IBM), I compared the opportunity to buy a relatively “cheap” stock struggling at its lows versus extremely expensive stocks soaring on momentum. It took two retests of the lows before IBM delivered the current breakout. The market has almost rolled back all those gains over the past two days, but I think IBM has a confirmed bottom. It should make for an attractive play in the next bullish phase of the market (or even during a deadcat bounce market).
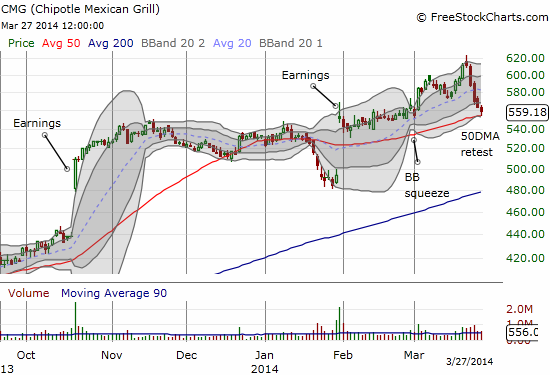
Chipotle Mexican Grill (CMG) has enjoyed strong momentum in recent months on the wings of positively received earnings reports. I tried to play the last pop with call options but lost out as the stock mainly churned. I kicked myself twice as I missed out on a bullish Bollinger Band squeeze that delivered a nice surge and then a second chance to ride when the 20DMA uptrend held as support. Now I am of course wondering whether this retest of the 50DMA is a third chance. CMG has suffered mightily in he past week like most momentum stocks, but a 10% drop in 5 trading days is a lot for any stock. A bounce here makes a lot of sense.
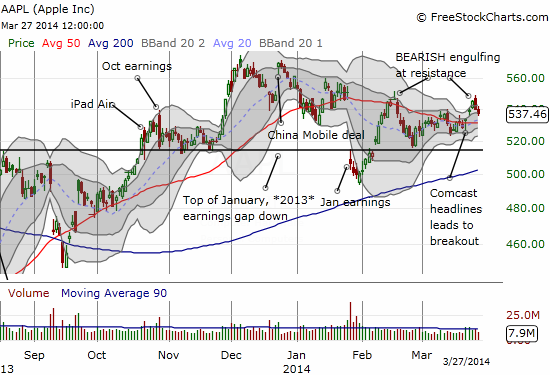
I have not posted on Apple in quite some time. The Apple Trading Model (ATM) continues to perform well. I am finding that it is particularly good in the kind of chop AAPL has delivered in its attempt to hold its post-earnings recovery. Apple started the week in the bullish afterglow of headlines of dealings with Comcast, but the momentum stopped cold at the February highs. Toss in a bearish engulfing pattern and I see a return to a bearish bias for the stock. The selling could get very strong in sympathy with a stronger market sell-off. Note that one of the Apple Trading Model’s finds is that Apple has traded up on every single Monday of this year. I have played this by either buying call options in the face of Friday’s typical weakness and/or moving quickly on Monday’s open if Friday prints too much upside.
Interestingly, AAPL’s open interest put/call ratio has risen sharply in recent weeks. This typically supports a rally in AAPL shares as, presumably, investors are inclined to hold shares against protection.
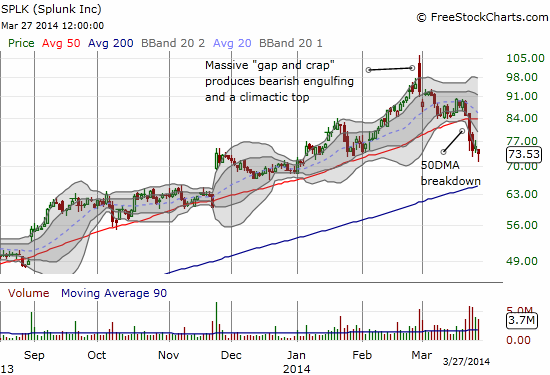
Splunk (SPLK) is currently one of my poster children for the day momentum died. A trader simply cannot get a cleaner topping pattern than this one. On Friday, February 28, SPLK gapped up 7.8% and managed to over-extend a little further above the upper-BB. The celebration was short-lived as the stock proceeded to fade so sharply that it closed below the low of the previous day. The gap represents the last over-eager buyers piling into the stock. The crap represents the exhaustion of buyers as enthusiasm finally runs its course. The close below the previous day’s low signals the end of momentum and the incentive to sell. The current breakdown below the 50DMA serves to solidify the top even as SPLK’s overall uptrend remains intact for now. Note closely how downward momentum is slowing down with repeated attempts by sellers to close the stock well below its lower-BB. A bounce is on its way…and it should be very fade-able. I caught the follow-through selling in the immediate wake of the gap and crap, but I missed the 50DMA breakdown.
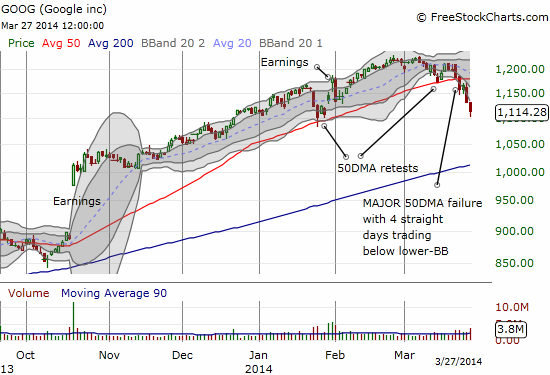
Google (GOOG) continues to face intense selling pressure. Unlike the sell-off in SPLK, sellers have been able to extend GOOG well past its lower-BB and keep it there. This is a display of strength by sellers. Given the run-up since October earnings, it is very unlikely sellers will get exhausted anytime soon. That is, there are a lot of profits to protect. A bounce from here could easily happen, but it could be even easier to fade than SPLK. Traders should watch very closely what happens once (if?) GOOG retests the pre-earnings low in January that featured a successful 50DMA test.
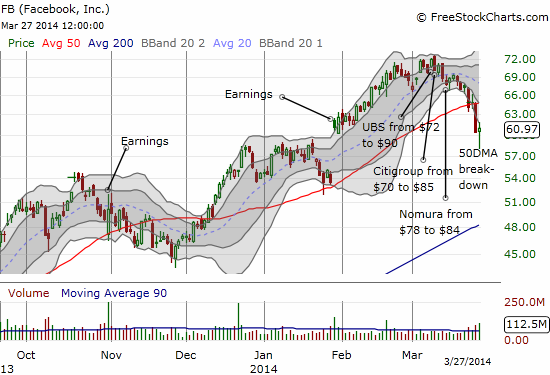
I need to write a full piece on Facebook (FB) and my trading strategy on it (accumulate a short position over time and play rallies with call options as I wait for a top and return to earth). I maintain that FB has not just put in A top, it has printed THE top. FB has erased all its gains after its big post-earnings gap up. A series of rapid fire upgrades with large price targets failed to save the stock. FB fell swiftly about 7% as it broke down below its 50DMA on Wednesday. Sellers managed to keep the stock pinned to the lows on the day. Today, sellers pressed hard again but finally gave way to a classic bounce from oversold conditions (relative to the lower-BB). I will be watching closely to see whether FB can completely close its post-earnings gap as well as its behavior around 50DMA resistance. Since I am actively watching for quick trades with call options, I managed to catch today’s oversold bounce, adding to the cushion on my short shares.
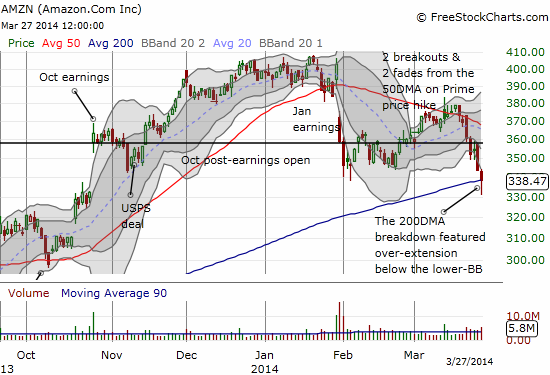
Finally, you KNOW tech stocks are weakening when even stubborn Amazon.com (AMZN) is getting sold hand over fist. AMZN today managed to break down below its 200DMA for the first time in ELEVEN months. It managed to pick itself up as it over-extended below the lower-BB. Still, this is a post-earnings low and produces a lower low following a lower high. With the 50DMA rapidly declining and already providing successful resistance, it will take AMZN quite a bit of time to recover from this technical damage…if it ever does anytime soon.
Daily T2108 vs the S&P 500
")
Black line: T2108 (measured on the right); Green line: S&P 500 (for comparative purposes)
Red line: T2108 Overbought (70%); Blue line: T2108 Oversold (20%)
Weekly T2108

*All charts created using freestockcharts.com unless otherwise stated
Related links:
The T2108 Resource Page
Expanded daily chart of T2108 versus the S&P 500
Expanded weekly chart of T2108
Be careful out there!
Full disclosure: long SSO puts, net short Australian dollar, long GOOG call options, long AAPL shares and puts, short FB shares and long call options, long EEM puts