
(T2108 measures the percentage of stocks trading above their respective 40-day moving averages [DMAs]. It helps to identify extremes in market sentiment that are likely to reverse. To learn more about it, see my T2108 Resource Page. You can follow real-time T2108 commentary on twitter using the #T2108 hashtag. T2108-related trades and other trades are posted on twitter using the #120trade hashtag)
T2108 Status: 60.2%
VIX Status: 15.5
General (Short-term) Trading Call: Short (bearish bias)
Active T2108 periods: Day #157 over 20%, Day #6 over 50%, Day #3 over 60% (overperiod), Day #19 under 70%
Reference Charts (click for view of last 6 months from Stockcharts.com):
S&P 500 or SPY
SDS (ProShares UltraShort S&P500)
U.S. Dollar Index (volatility index)
EEM (iShares MSCI Emerging Markets)
VIX (volatility index)
VXX (iPath S&P 500 VIX Short-Term Futures ETN)
EWG (iShares MSCI Germany Index Fund)
CAT (Caterpillar).
Commentary
Here we go again it seems. Just as I am thinking T2108 will reach overbought levels in a week’s time, a notable reversal of fortunes steps in to interrupt the regularly scheduled programming. The S&P 500 (SPY) rose exactly to 1847.50 at its high of the day before reversing sharply (presumably on some kind of disappointment with the minutes from the last meeting of the Federal Reserve). This fade looks very bearish because the S&P 500 stopped nickles short of the all-time closing high at 1848.38 (January 15, 2014) which itself was just marginally better than the previous closing high at 1848.36 (December 31, 2013). The index also closed lower than the previous day. All it needs to do now is crack through support at the 50-day moving average (DMA), and I start thinking of a confirmed triple top.
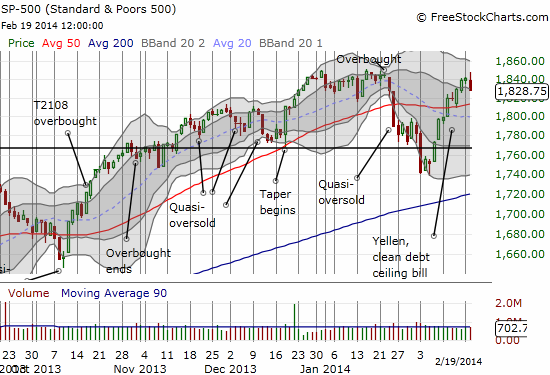
T2108 reached as high as 66.4% – oh so close to overbought at 70% – before tumbling to close at 60.2%. This kind of drop qualifies as the kind of sharp rejection from overbought levels that tends to precede some kind of larger sell-off. Thus, my trading bias is now bearish with NO caveats.
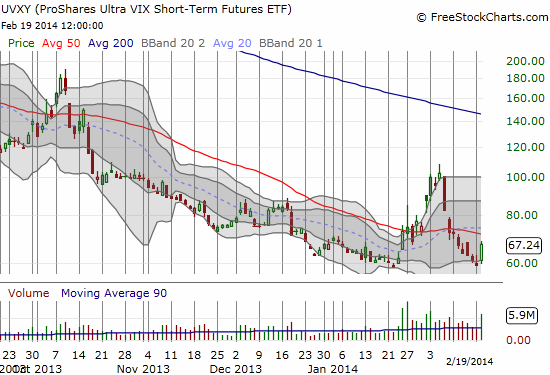
The volatility index (VIX) turned the 15.35 level into another effective pivot. The VIX came to life again after a sound beating from its recent high on February 3rd by popping 11.8%. This move was enough to push ProShares Ultra VIX Short-Term Futures ETF (UVXY) off its bottom. Such high volume surges off a bottom are typically more than a 1-day turn-around.
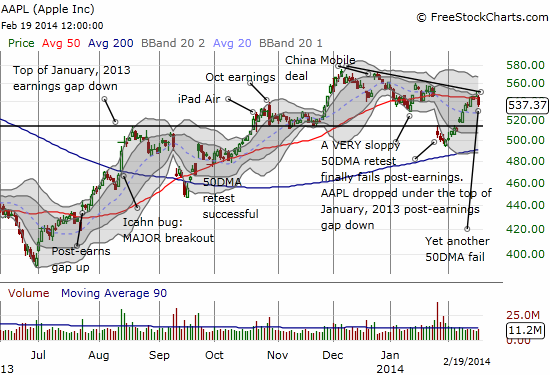
And if these signs are not enough, how about Apple (AAPL) suddenly plunging 1.6% to dip below its 50DMA again. This move shows Apple continues to struggle to break free of this important pivot point. This failure is ominous for two other reasons: 1) it comes a day after Apple officially closed its January post-earnings gap down only to suffer a fade, and 2) it preserves a downtrend from recent highs. If AAPL sticks to the script of the Apple Trading Model (ATM) the stock will continue downward over the next two days.
Whirlpool (WHR) is also printing an ominous chart. After a valiant attempt to recover from a post-earnings “gap and crap”, WHR has printed an ominous failure at 200DMA resistance. WHR sliced right through this line post-earnings for the first time since around mid-2012.

These are just a few hints of cracks in the marble for the bulls. If the market follows through with selling (as seems the case with weak China PMI numbers tonight), a lot more charts will flash bright red warning signs.
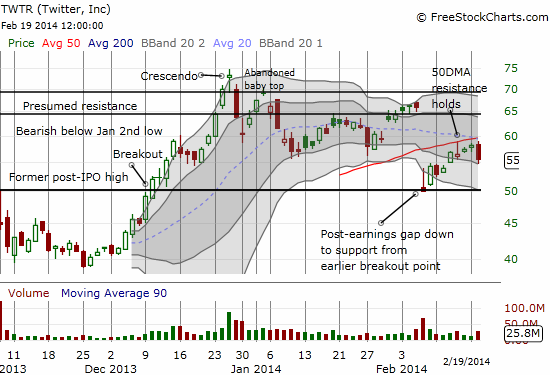
I conclude with this chart of Twitter (TWTR) which suggests that, as I expected, the 50DMA will cap TWTR’s short-term progress. I am still expecting a (likely successful) retest of the $50 level in the near-term.
Daily T2108 vs the S&P 500
")
Black line: T2108 (measured on the right); Green line: S&P 500 (for comparative purposes)
Red line: T2108 Overbought (70%); Blue line: T2108 Oversold (20%)
Weekly T2108

*All charts created using freestockcharts.com unless otherwise stated
Related links:
The T2108 Resource Page
Expanded daily chart of T2108 versus the S&P 500
Expanded weekly chart of T2108
Be careful out there!
Full disclosure: long SPHB and SPLV and SSO puts; long AAPL shares, calls, and put spread; long WHR puts, long TWTR puts