
(T2108 measures the percentage of stocks trading above their respective 40-day moving averages [DMAs]. It helps to identify extremes in market sentiment that are likely to reverse. To learn more about it, see my T2108 Resource Page. You can follow real-time T2108 commentary on twitter using the #T2108 hashtag. T2108-related trades and other trades are posted on twitter using the #120trade hashtag)
T2108 Status: 66.9% (69.3% at today’s high!)
VIX Status: 14.2
General (Short-term) Trading Call: Short (bearish bias)
Active T2108 periods: Day #160 over 20%, Day #9 over 50%, Day #6 over 60% (overperiod), Day #22 under 70%
Reference Charts (click for view of last 6 months from Stockcharts.com):
S&P 500 or SPY
SDS (ProShares UltraShort S&P500)
U.S. Dollar Index (volatility index)
EEM (iShares MSCI Emerging Markets)
VIX (volatility index)
VXX (iPath S&P 500 VIX Short-Term Futures ETN)
EWG (iShares MSCI Germany Index Fund)
CAT (Caterpillar).
Commentary
Just 0.2 percentage points away from being able to round up and declare that T2108 actually tripped the overbought threshold. Not only was today a tantalizing tease, but also it completes yet another about face for market sentiment and direction. Six days ago, I was near certain T2108 was on its way to an important rendezvous with overbought conditions. The very next day, the market flipped and flashed visions of past near misses that heralded notable sell-offs. The flip lasted all of one day as sellers once again proved incapable of follow-through. Three days and two tranches of wasting ProShares Ultra S&P500 (SSO) puts later, T2108 continues the original journey. It closed today at 66.9%…a simple nudge away from overbought conditions.
All this churn has turned the recent all-time highs into a major battleground. Today’s close marks the fourth time the S&P 500 has failed to finish above 1850 since hitting an intra-day high (at that time) of 1849.44 on December 31, 2013.
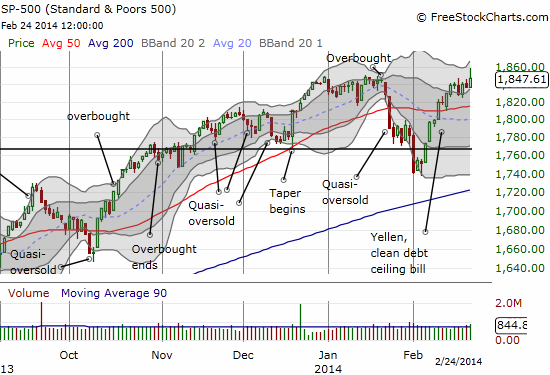
The intra-day fade from fresh all-time highs is a bit ominous since the S&P 500 (SPY) missed closing at a new all-time high. I am stubbornly maintaining a bearish bias even though a quadruple top is a very rare beast to behold. The S&P 500 needs to close with a new all-time high and follow through into overbought levels to force a changed assessment. As a reminder, my revised methodology for overbought conditions allows for trading bullishly as long as T2108 remains overbought and avoids printing any bearish chart patterns.
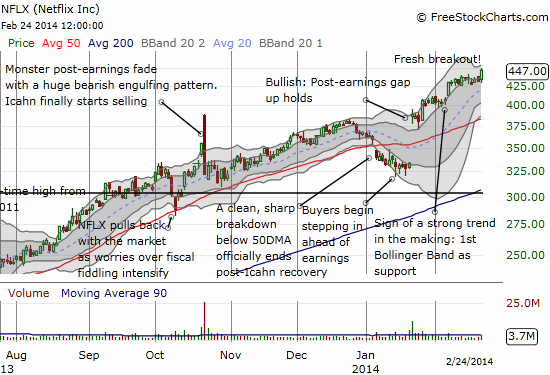
Note well that I have some trades that are in direct conflict with my bearish leanings. I prefer to call them “hedges.” My eyes have flipped from seeing bearish setups to bullish ones. One of the more impressive and important bullish setups on my list is Netflix (NFLX). Today, NFLX crossed the important $445 barrier that marks the short end of the bullish call spread I recommended almost three weeks ago. The chart remains in an uptrend and remains very bullish in my opinion. Today’s large breakout comes on the heels of the removal of a potentially major headwind: NFLX struck a deal with Comcast to guarantee fast internet access on Comcast systems.
Finally, note that February’s mildness relative to January is quite consistent with historical monthly maximum drawdowns on the S&P 500. If March is consistent with history, it will be even milder than February. If the bears are going to make a (VERY) rare stand, this week will need to be the time….
Daily T2108 vs the S&P 500
")
Black line: T2108 (measured on the right); Green line: S&P 500 (for comparative purposes)
Red line: T2108 Overbought (70%); Blue line: T2108 Oversold (20%)
Weekly T2108

*All charts created using freestockcharts.com unless otherwise stated
Related links:
The T2108 Resource Page
Expanded daily chart of T2108 versus the S&P 500
Expanded weekly chart of T2108
Be careful out there!
Full disclosure: long SPHB and SPLV and SSO puts; long AAPL shares, calls, and put spread; long WHR puts, long TWTR puts