
(T2108 measures the percentage of stocks trading above their respective 40-day moving averages [DMAs]. It helps to identify extremes in market sentiment that are likely to reverse. To learn more about it, see my T2108 Resource Page. You can follow real-time T2108 commentary on twitter using the #T2108 hashtag. T2108-related trades and other trades are posted on twitter using the #120trade hashtag)
T2108 Status: 62.8%
VIX Status: 13.6 (the plunge in volatility continues apace)
General (Short-term) Trading Call: Short (bearish bias) still with caveats (see below)
Active T2108 periods: Day #155 over 20%, Day #4 over 50%, Day #1 over 60% (overperiod), Day #17 under 70%
Reference Charts (click for view of last 6 months from Stockcharts.com):
S&P 500 or SPY
SDS (ProShares UltraShort S&P500)
U.S. Dollar Index (volatility index)
EEM (iShares MSCI Emerging Markets)
VIX (volatility index)
VXX (iPath S&P 500 VIX Short-Term Futures ETN)
EWG (iShares MSCI Germany Index Fund)
CAT (Caterpillar).
Commentary
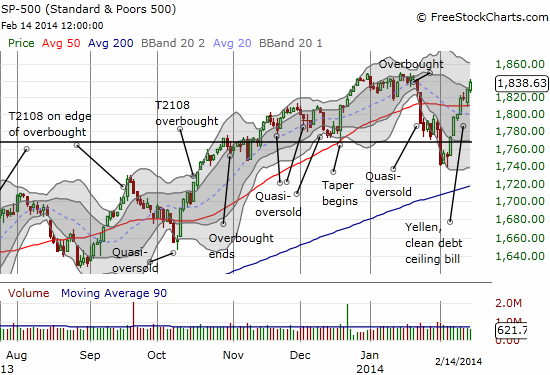
The retreat of the bears (and the stampede of the bulls) continued through most of last week, culminating in a Valentine’s Day (February 14, 2014 in the USA) that showed no love for the bears. The S&P 500 gained 0.5% to close just a hair below a fresh all-time high. PowerShares QQQ (QQQ) hit levels last seen in late 2000 and the NASDAQ is just about there as well. The volatility index, the VIX, continued its plunge by closing the week at 13.6 and completing a roundtrip back to where it was on January 23, 2014. T2108 is now bearing down on overbought levels again. Overall, things are looking bad for the bears.
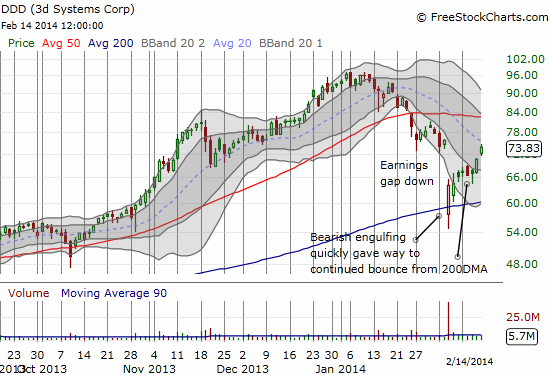
All this momentum swiftly ended any thought I had that the 50-day moving average (DMA) would serve as any kind of temporary brake on the rally. It was another clear reminder of the importance of waiting for confirmation on support and resistance. This reminder rang true on a short setup I thought would be a clear winner: 3d Systems (DDD).
I noted DDD in my last T2108 Update (ironically titled “Bears In Retreat”). The very next day, Citigroup increased its price target from $68 to $78. The stock gapped up slightly but then sold off. My relief was temporary as the stock then bounced from the lows with a small gain on the day. That trading action should have been my signal that buyers were stepping in and sellers were drying up! It only took two more days for DDD to essentially close its post-earnings gap. There are several more points of potential resistance from here, but I am much more wary of trying to play them. The 20DMA in particular should be tough resistance because it defines the current downtrend and coincides with the close of the post-earnings gap down.
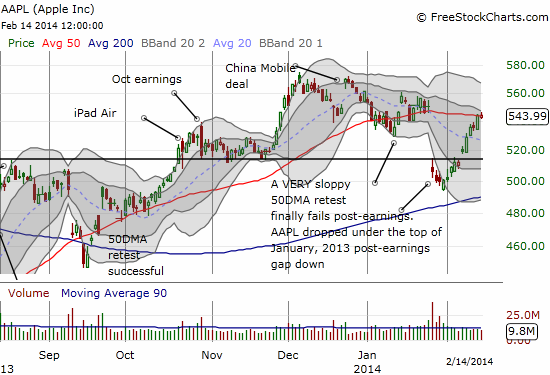
Speaking of gap fills, Apple (AAPL) has almost completed a very surprising gap fill. It seems AAPL’s accelerated buyback has done the trick to move the stock past its latest post-earnings disaster. This momentum even forced me to adjust my Apple Trading Model (ATM) methods last week in order to respect the current, sharp uptrend from post-earnings lows. The ATM projected up days for Monday, Tuesday, and Wednesday and down days for Thursday and Friday. Bingo for the first two days of the week. Wednesday was a major disappointment as I loaded up in anticipation. Despite the down prediction for Thursday, I hung onto my call position and was amply rewarded the next day (whew!). (This experience has me thinking about further tweaks to the ATM to consider prediction lags. Stay tuned on this one!)
Although the stock closed strong with a tick above the 50DMA, I decided to play the bearish prediction for Friday. The 50DMA essentially held as resistance but not much else happened. AAPL is closing in on a 10% gain from its post-earnings low with barely a breath of rest. If not for the buyback action, I would say the stock is ripe for a pullback from resistance. Instead, I will say that this coming week will prove pivotal in determining whether this buyback action has generated sustainable bullish feelings for the stock again. No ATM prediction for Tuesday since Monday is a holiday.
With these kind of charts showing bulls wrestling control away from the bears, I find myself once again bracing for the strong possibility of an extended overbought rally. T2108 could easily go overbought (70% or more) this week with the S&P 500 closing at fresh all-time highs – a perfectly explosive recipe for the bulls to really run the flag up the flagpole.
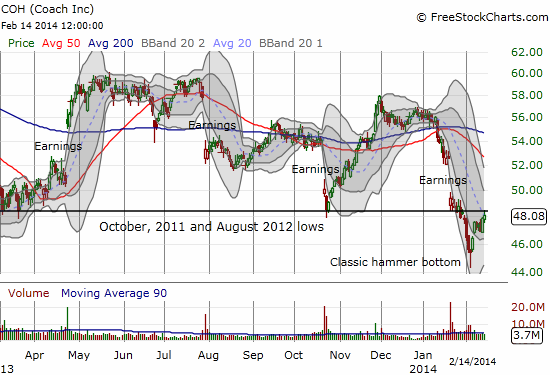
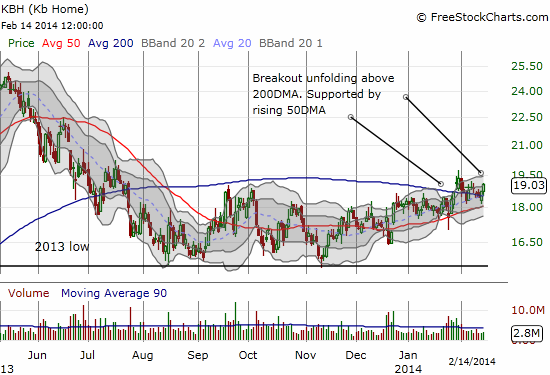
With those bullish tidings in mind, here are two more charts of recovery stocks: Coach (COH) and Kb Home (KBH). See the notes in the charts for explanations for the setups.
Daily T2108 vs the S&P 500
")
Black line: T2108 (measured on the right); Green line: S&P 500 (for comparative purposes)
Red line: T2108 Overbought (70%); Blue line: T2108 Oversold (20%)
Weekly T2108

*All charts created using freestockcharts.com unless otherwise stated
Related links:
The T2108 Resource Page
Expanded daily chart of T2108 versus the S&P 500
Expanded weekly chart of T2108
Be careful out there!
Full disclosure: long SPHB and SPLV and SSO puts; long AAPL shares and put spread; long DDD puts; long KBH call options
Like your writing style Dr. D. Is your T2108 another approach to a cycle indicator for indexes? Have you explored Hurst or http://sentienttrader.com/#sthash.UdwmrhpW.dpbs? I’m with another business, but we evaluate cycles as part of our MBS analysis.
Cheers.
Brent
T2108 is definitely a cyclical indicator. I try to keep my quiver of indicators small and simple.