
(T2108 measures the percentage of stocks trading above their respective 40-day moving averages [DMAs]. It helps to identify extremes in market sentiment that are likely to reverse. To learn more about it, see my T2108 Resource Page. You can follow real-time T2108 commentary on twitter using the #T2108 hashtag. T2108-related trades and other trades are posted on twitter using the #120trade hashtag)
T2108 Status: 65.8%
VIX Status: 12.3
General (Short-term) Trading Call: Short (bearish bias).
Active T2108 periods: Day #133 over 20%, Day #8 over 60% (overperiod), Day #48 under 70%
Reference Charts (click for view of last 6 months from Stockcharts.com):
S&P 500 or SPY
SDS (ProShares UltraShort S&P500)
U.S. Dollar Index (volatility index)
EEM (iShares MSCI Emerging Markets)
VIX (volatility index)
VXX (iPath S&P 500 VIX Short-Term Futures ETN)
EWG (iShares MSCI Germany Index Fund)
CAT (Caterpillar)
Commentary
Whiplash.
That is the best way to describe the trading so far this week. Just when I thought it safe to switch from a bullish to a bearish bias, the S&P 500 zips upward, almost reversing all of Monday’s losses. The S&P 500 remains in the bearish zone, but I am now on alert and bracing for another sentiment shift given the strength of today’s move.
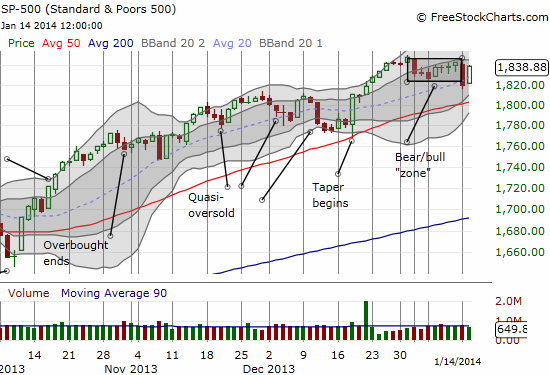
T2108 closed the day at 65.8% – “two hairs” away from overbought. If the market goes into overbought from here, I will be in the always uncomfortable position of calling for an extended overbought run. For now, the bias remains bearish. I even stuck to the rules I laid out in the last T2108 Update and opened up my first tranche of ProShares Ultra S&P500 (SSO) puts. I was happy to get the puts for a small discount on the bounce. I bought a little early but the puts did not decline enough by the close to justify going for the second tranche. That purchase may happen on the next bounce….
The bullish action allowed me to exit my UVXY puts at a profit. UVXY closed the day down 8.2% with a fresh all-time low. After yesterday’s near miss at my higher profit target, I was eager to call it a wrap. Seeing UVXY’s reversal has firmed my opinion (trading strategy) that all rallies in UVXY must be faded.
The 2-day whiplash in the major indices is nothing compared to some of the whiplash in individual stocks. I will use a chart review to go through three examples.
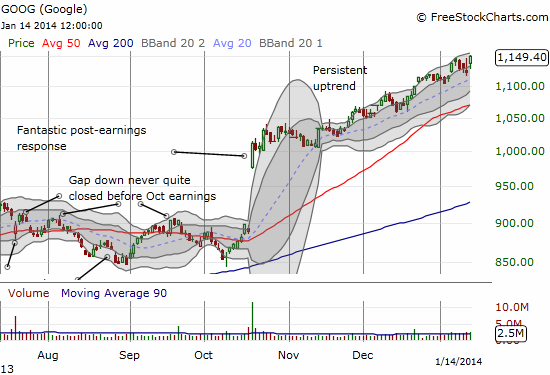
In the last T2108 Update, I talked about the successful Google (GOOG) trade using a model fashioned after the Apple Trading Model (ATM). The odds from that model projected another down day. Just like Monday, I waited out the initial pop in the stock before buying a put option. THIS time, GOOG kept motoring right through what should have been resistance from Monday’s high. So after a sharp reversal on Monday to close down on the day, GOOG turns right around with a strong 2.4% gain to fresh all-time highs. The model projects 55% odds for upside tomorrow. These odds are not strong enough to justify a trade, but the technicals alone remind us that GOOG’s overall bias remains firmly up and to the right.
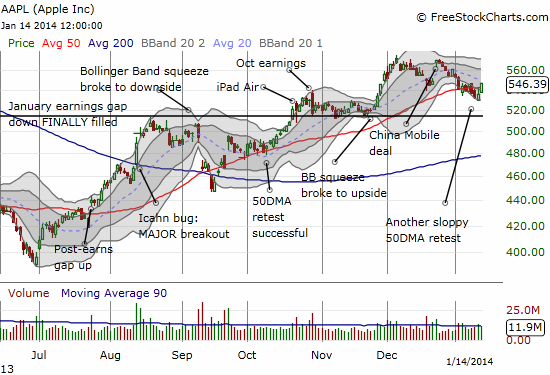
Apple (AAPL) put on a major surprise by powering right through its 50DMA resistance. In yesterday’s T2108 Update, I noted that the ATM produced 100% odds of an up day but near certainty of a fade from the open. I also noted that I was much more interested in fading than in playing the upside. My sentiment was influenced by a combination of the on-going downtrend channel and an assumption that the 50DMA resistance would hold. Now, AAPL is in the “open field.” A close above the downtrending 20DMA will be a bullish turning point in the stock. For tomorrow, the ATM produced 73% odds of upside and 47% odds of a continuation of upside from the open.
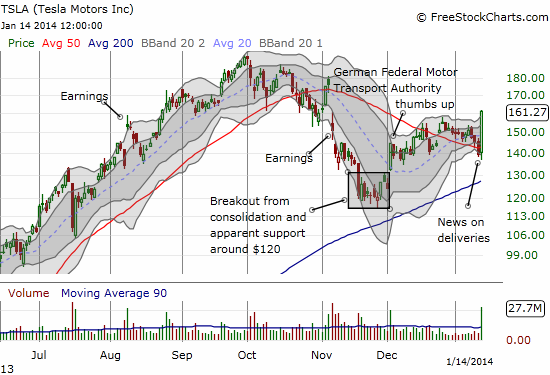
Tesla Motors (TSLA) enjoyed a breakout day in an awesome display of whiplash. As of yesterday, the stock looked ready for a fresh sell-off as it sagged well below 50DMA resistance. The company released good news about deliveries and BAM! A 15.7% gain in a flash the took the stock to a fresh 2-month high that cleared all sorts of resistance. I just barely missed playing this action. I had a stock alert set for $143, but I was slow to look for any news. Before I realized what was going on, the stock was already up 8% and well-above my comfortzone for an attempt at a quick trade.
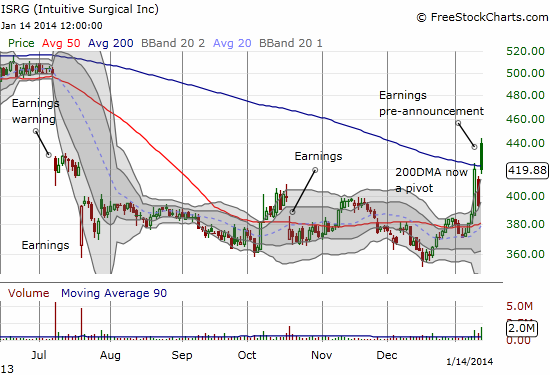
The biggest whiplash of the day (besides perhaps Intercept Pharmaceuticals!) was Intuitive Surgical (ISRG). I also talked about this trade in the last T2108 Update, and it turned into what I believe is one of my biggest single-day trades of all-time. My main regret is that my readers could not profit along with me because I bought my call option near the close of the day, and I did not talk about it until the T2108 Update. While I concluded that “something is up,” I sure was not anticipating anything like this.
ISRG pre-announced earnings and clearly delivered some (temporary) relief to traders and investors. The stock soared about 12% at the open, and I promptly sold my call option at a 13x increase in value (I forgot to mention that I threw in some shares for good measure in case I had to wait beyond this week for “something” to happen). I was not surprised to see the stock promptly fade since it was so high above the upper-Bollinger Band (BB), but I am a bit surprised the stock faded so far that it closed below its 200DMA (equal to Friday’s big close).
I am sure Herb Greenberg’s reiteration of his skepticism helped grease the skids.
ISRG has earned a permanent spot on my trading watch list. I will include the company’s pre-announcement when I do my write-up on the recent articles in ACOG.
Finally, speaking of “something up,” I think there is something up with the general stock market. This whiplash “feels” like the prelude to something big in SOME direction. Bullish and bearish traders need to be on their toes more than normal, ready to pounce on opportunity in an instant.
Daily T2108 vs the S&P 500
")
Black line: T2108 (measured on the right); Green line: S&P 500 (for comparative purposes)
Red line: T2108 Overbought (70%); Blue line: T2108 Oversold (20%)
Weekly T2108

*All charts created using freestockcharts.com unless otherwise stated
Related links:
The T2108 Resource Page
Expanded daily chart of T2108 versus the S&P 500
Expanded weekly chart of T2108
Be careful out there!
Full disclosure: long SPHB and SPLV and SSO puts (pairs trade), long AAPL shares and puts, long GOOG puts