
(T2108 measures the percentage of stocks trading above their respective 40-day moving averages [DMAs]. It helps to identify extremes in market sentiment that are likely to reverse. To learn more about it, see my T2108 Resource Page. You can follow real-time T2108 commentary on twitter using the #T2108 hashtag. T2108-related trades and other trades are posted on twitter using the #120trade hashtag)
T2108 Status: 60.3%
VIX Status: 13.3
General (Short-term) Trading Call: Short (bearish bias). See below for important details and caveats.
Active T2108 periods: Day #132 over 20%, Day #7 over 60% (overperiod), Day #47 under 70%
Reference Charts (click for view of last 6 months from Stockcharts.com):
S&P 500 or SPY
SDS (ProShares UltraShort S&P500)
U.S. Dollar Index (volatility index)
EEM (iShares MSCI Emerging Markets)
VIX (volatility index)
VXX (iPath S&P 500 VIX Short-Term Futures ETN)
EWG (iShares MSCI Germany Index Fund)
CAT (Caterpillar)
Commentary
July 23, 2013: T2108 = 68.3%
September 18, 2013: T2108 = 68.9%
January 10, 2014: T2108 = 68.6%
On the above dates, T2108 looked ready to cross into overbought territory but failed to do so during the given cycle. In the case of September’s close encounter, the failure led immediately to a correction in the S&P 500’s (SPY) uptrend. It took three weeks for a sell-off to begin after July’s close encounter.
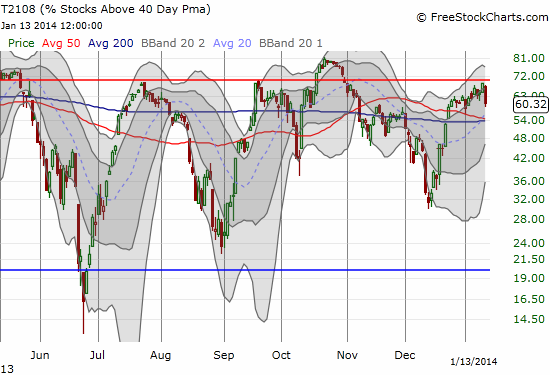
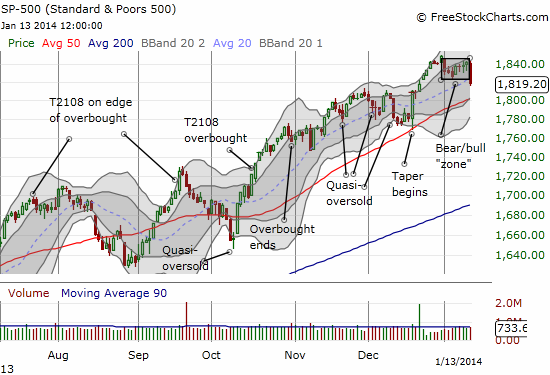
The latest failure to cross into overbought territory is the most dramatic of the bunch. It was accompanied by a sell-off so sharp that it set a 3-week low and signaled a continuation of 2014’s weak start. This event triggers my change in bias from bullish to bearish. In the chart above, I drew a bear/bull zone. As discussed in the last T2108 Update, a break below 1823 marks a bearish signal:
“For bears, particularly once/if T2108 hits overbought, the current pattern also provides a definitive trigger for shorts. A close below the recent low around 1823 would set up tough overhead resistance in the current pattern. This provides for a higher shorting point than the previous trigger of the round number 1800. Note that 1800 is now right at the critical 50DMA uptrend.”
The top of the bear/bull zone should serve as stiff resistance going forward. A close above it, flips advantage back to the bulls. The bearish bias is below the bear/bull zone. Current momentum suggests another test of the 50DMA is in the works. I will be looking to get into ProShares Ultra S&P500 (SSO) puts, hopefully on a bounce.
The bearish bias of course comes with a footnote. The uptrend for the S&P 500 remains well intact. It will take a lot of selling to break the index’s current momentum and/or the uptrend. So a retest of the 50DMA must be respected as a potentially healthy run-off in price.
The VIX popped today of course; it rose 9.4%. The move sent ProShares Ultra VIX Short-Term Futures ETF (UVXY) up 7.8%. UVXY started into the plunge I was looking for this week, but momentum stopped on a dime. The 15-minute chart below shows how UVXY delivered a nice continuation of Friday’s downward trend…until a volume surge marked off a sustained bottom.
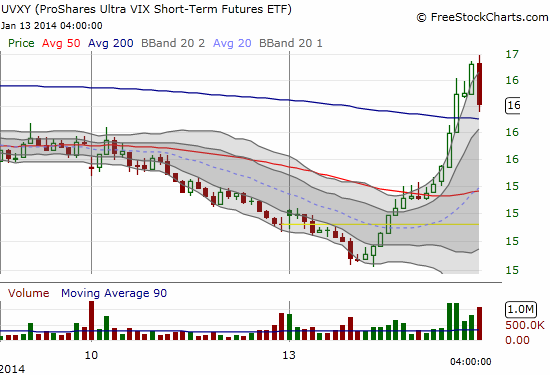
As it turned out, I just missed selling out my puts on UVXY for a nice profit. Instead, the puts closed with a near 50% loss. However, this story has a good ending because I may have stumbled into a potentially very profitable hedging strategy. Before today’s open, I refreshed my Google Trading Model (GTM) – modeled off the Apple Trading Model – and discovered the odds of upside for the day was 22%. Even though GOOG was soaring right after the open, I decided to just follow the rule’s assessment and opened up a single put option. The sudden plunge in the market sent that put out to pasture with a 4x increase in value.
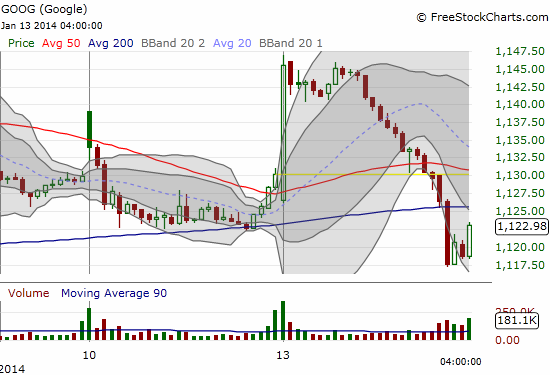
I now need to investigate sometime soon where I can find inverse correlations (relationships) between UVXY and individual stocks. Trading with options gives a a very explosive potential when price moves appear extended as was the case here in both UVXY and GOOG. Stay tuned for more developments in coming days or weeks. (The odds are against GOOG again with only 27% chance of upside tomorrow, Tuesday, January 14, 2014).
Speaking of Apple (AAPL), the stock decided to be contrary again. While the market swooned, AAPL zoomed. Its flourish in the final minutes delivered a positive gain on the day. AAPL ended up with a move that was neatly defined by the current downtrend with a failure to break the 50DMA (again) as a bonus. Click here for a close-up graph. So, amazingly, the ATM managed to get another AAPL daily prediction correct (from yesterday’s close; the prediction from the open was exactly 50/50). Tomorrow’s prediction is for 100% chance of upside but this is based on just 8 similar cases last year. The prediction off the open is for near certainty of a fade. In other words, get ready again for more intraday fireworks on AAPL. I am much more interested in the potential fade than trying to play upside from the open.
I missed an opportunity to play the upside on AAPL for today. I hesitated at the open because the call options seemed “expensive.” In hindsight, they were expensive for a good reason! According to ETrade, the implied volatility on the $540 call option expiring this Friday is 23%, higher than the historical volatility 20.0%. This results in a call option that is priced at 33% above theoretical value. a good situation for call sellers, especially around the 50DMA. AAPL still seems to lack the gas to overcome this resistance, and I am still anticipating a retest around $514 as discussed in the last T2108 Update.
Finally, here is a daily chart of Intuitive Surgical (ISRG).
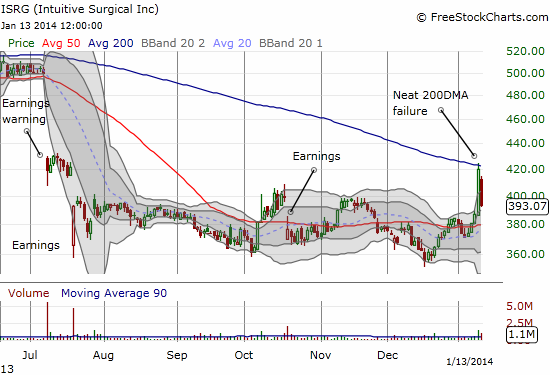
I like this chart because the stock seems to be consolidating since poor earnings guidance clobbered the stock six months ago. It shows that bears and sellers have not been able to break the stock any further despite the continued string of bad news.
On Friday, the stock went nuts, as if someone (or some people) finally got over-eager and over-anxious. ISRG soared right into the 200DMA out of nowhere. And then today the stock reversed almost all of Friday’s juicy gains. This is very suspicious trading behavior, and I suspect “something” is up. Either that, or some trader(s) is suddenly particularly effective and adept at manipulating this stock.
I took a flyer and bought a call option near the close. This is a case where I want to be positioned for that “something.” If selling follows through tomorrow, I will look for out-of-the-money puts. ISRG next reports earnings January 23rd. I expect the options ahead of those earnings to be extremely expensive. I am not likely to play those, but I will be watching closely. In the meantime, I hope to write soon about some interesting articles in the medical journal from the American Congress of Obstetricians and Gynecologists (ACOG) on the benefits and downsides of robotic surgery in various scenarios. Stay tuned!
Daily T2108 vs the S&P 500
")
Black line: T2108 (measured on the right); Green line: S&P 500 (for comparative purposes)
Red line: T2108 Overbought (70%); Blue line: T2108 Oversold (20%)
Weekly T2108

*All charts created using freestockcharts.com unless otherwise stated
Related links:
The T2108 Resource Page
Expanded daily chart of T2108 versus the S&P 500
Expanded weekly chart of T2108
Be careful out there!
Full disclosure: long SPHB and SPLV and SSO puts (pairs trade), long UVXY puts, long AAPL shares and puts, long ISRG calls