
(T2108 measures the percentage of stocks trading above their respective 40-day moving averages [DMAs]. It helps to identify extremes in market sentiment that are likely to reverse. To learn more about it, see my T2108 Resource Page. You can follow real-time T2108 commentary on twitter using the #T2108 hashtag. T2108-related trades and other trades are posted on twitter using the #120trade hashtag)
T2108 Status: 52.5% (17.2% increase)
VIX Status: 13.8
General (Short-term) Trading Call: Hold (bullish bias)
Active T2108 periods: Day #118 over 20% (overperiod), Day #31 under 60%, Day #36 under 70%
Reference Charts (click for view of last 6 months from Stockcharts.com):
S&P 500 or SPY
SDS (ProShares UltraShort S&P500)
U.S. Dollar Index (volatility index)
EEM (iShares MSCI Emerging Markets)
VIX (volatility index)
VXX (iPath S&P 500 VIX Short-Term Futures ETN)
EWG (iShares MSCI Germany Index Fund)
CAT (Caterpillar)
Commentary
The S&P 500 (SPY) ticked higher to yet another fresh all-time high with a 0.48% gain on the day. I believe this all-time high pretty much confirms a fresh upside push for the index that began with the post-Fed upside resolution. If we left the story there, we might think it was another day, another ho-hum dollar. However, T2108 tells a more dramatic story. For the second day in the last three, T2108 surged double digits.
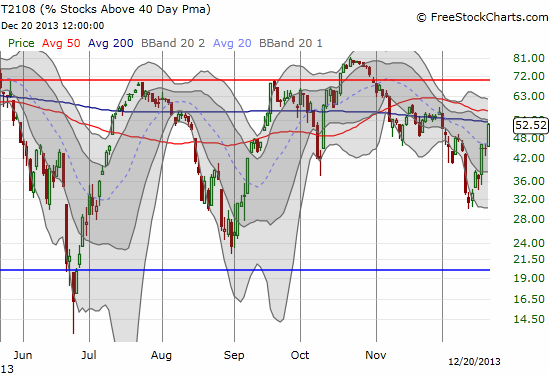
The first surge accompanied a large jump (+1.7%) in the S&P 500. This second surge now makes the run-up from quasi-oversold conditions look very similar to the early days of the rallies off (quasi)oversold conditions in June and September. T2108 has put us on notice. It also seems extremely unlikely we will get a more convenient time to buy on true oversold conditions anytime soon. Keep following the trend.
I end this short update with a chart review of Apple (AAPL). It has been a while since I reviewed its chart. The uptrend from the double-bottom in April and June continues for AAPL. Yet, once again, it is not participating in the general market move. Instead of a fresh high for 2013, AAPL is dipping toward its support at the 50DMA. There is a definitive short-term downtrend from the last high. I think it will pay well to watch how this downtrend develops within the context of the longer uptrend. If support holds, the upside should be as strong as November’s. If support fails, $515 comes immediately into play, and, I daresay will only slow down an eventual retest of the $500 level.
Click on image for larger view…
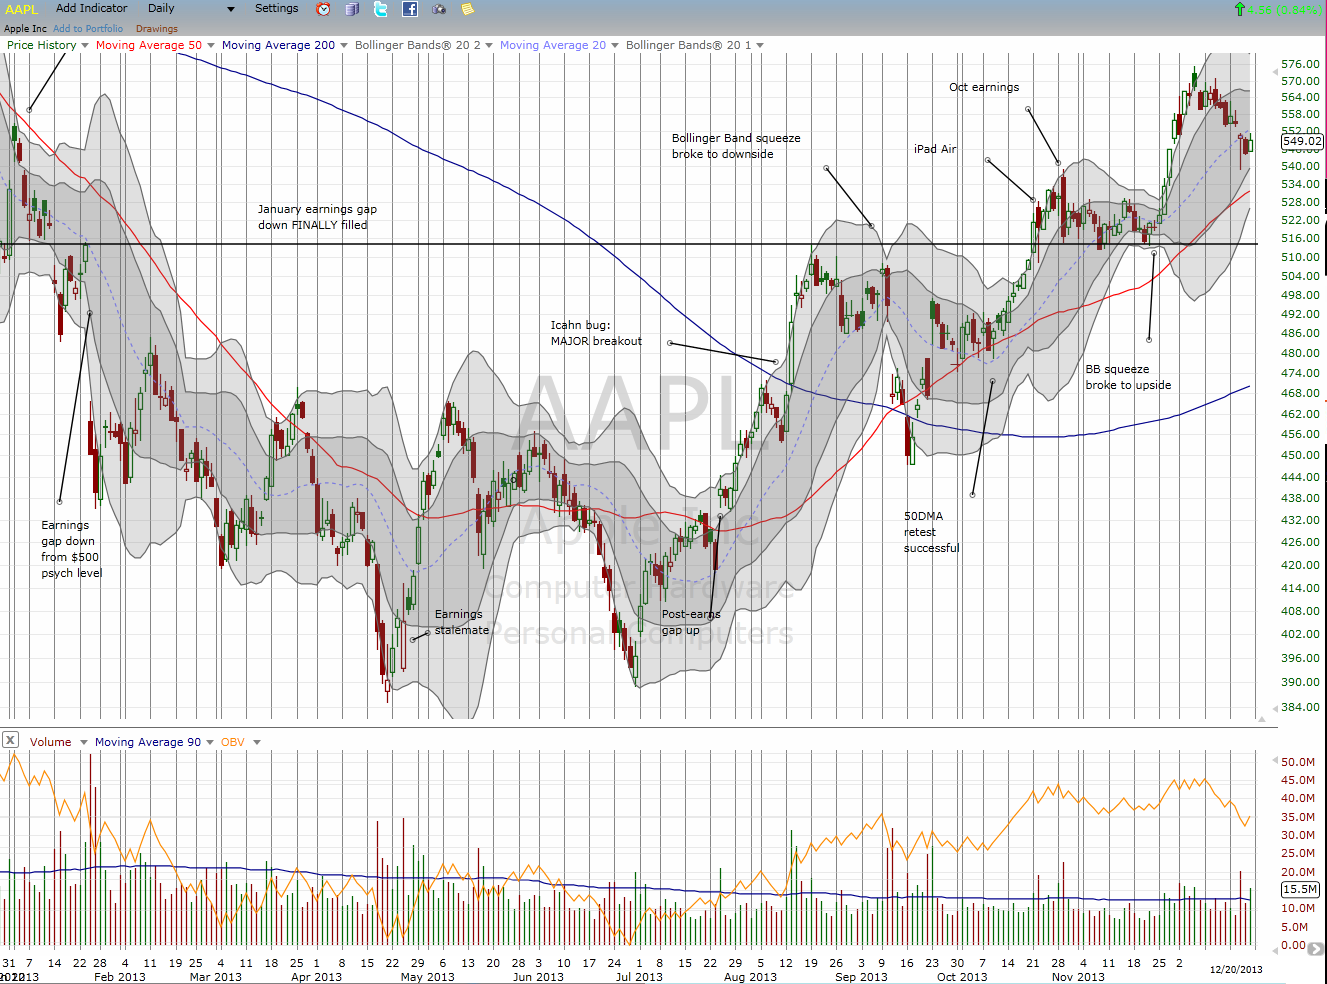
The Apple Trading Model (ATM) projects 90% of upside for Monday. These odds are further supported by a “100%” chance for upside after the open. As a reminder, these odds reflect historical frequencies. For more info on the ATM, see “Apple Trading Model Refined: Squeeze Resolves Into A Breakout (Includes More Lessons for Execution).”
Daily T2108 vs the S&P 500
")
Black line: T2108 (measured on the right); Green line: S&P 500 (for comparative purposes)
Red line: T2108 Overbought (70%); Blue line: T2108 Oversold (20%)
Weekly T2108

*All charts created using freestockcharts.com unless otherwise stated
Related links:
The T2108 Resource Page
Expanded daily chart of T2108 versus the S&P 500
Expanded weekly chart of T2108
Be careful out there!
Full disclosure: long SSO puts and calls, long AAPL shares and calls